

Question: Excel Project: Well-Designed Visualizations The following visualization (viz) shows all state taxes and fees collected for the state of New York from 2014 to 2018,
Excel Project: Well-Designed Visualizations
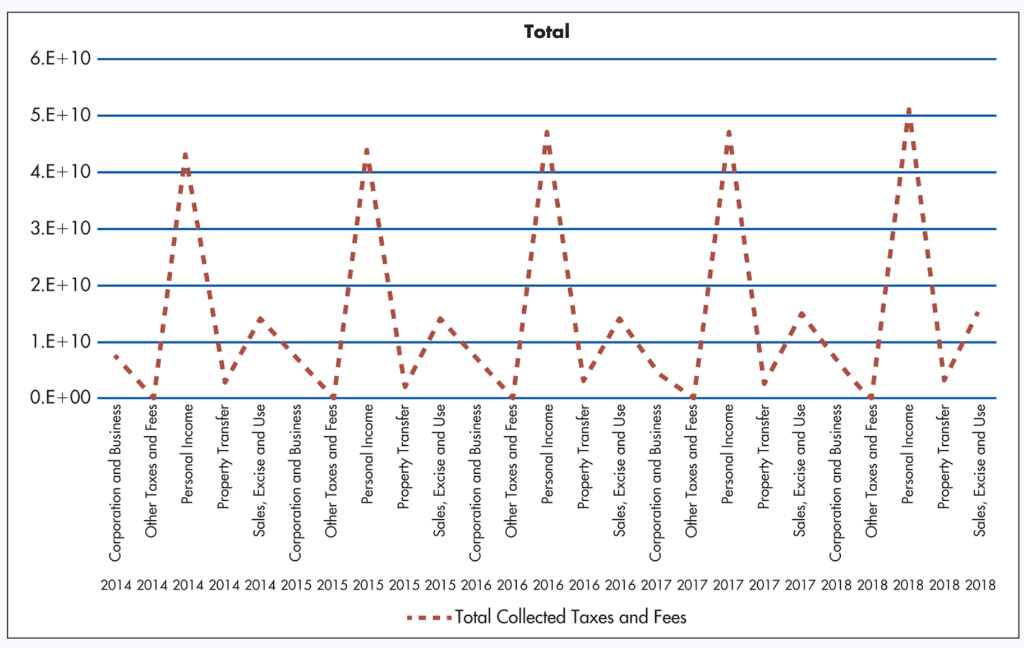
The following visualization (viz) shows all state taxes and fees collected for the state of New York from 2014 to 2018, inclusive.
 Required:
For the viz, do the following:
1) Describe the way you would change the viz to
(a) simplify the data presentation
(b) properly emphasize the objective of the stakeholder. Assume the objective of the stakeholder of this viz is to compare how each type of tax collections changes over time.
2) Using the data from the New York State taxes, implement some of the ideas you suggested for part 1 to simplify the viz and emphasize importance.
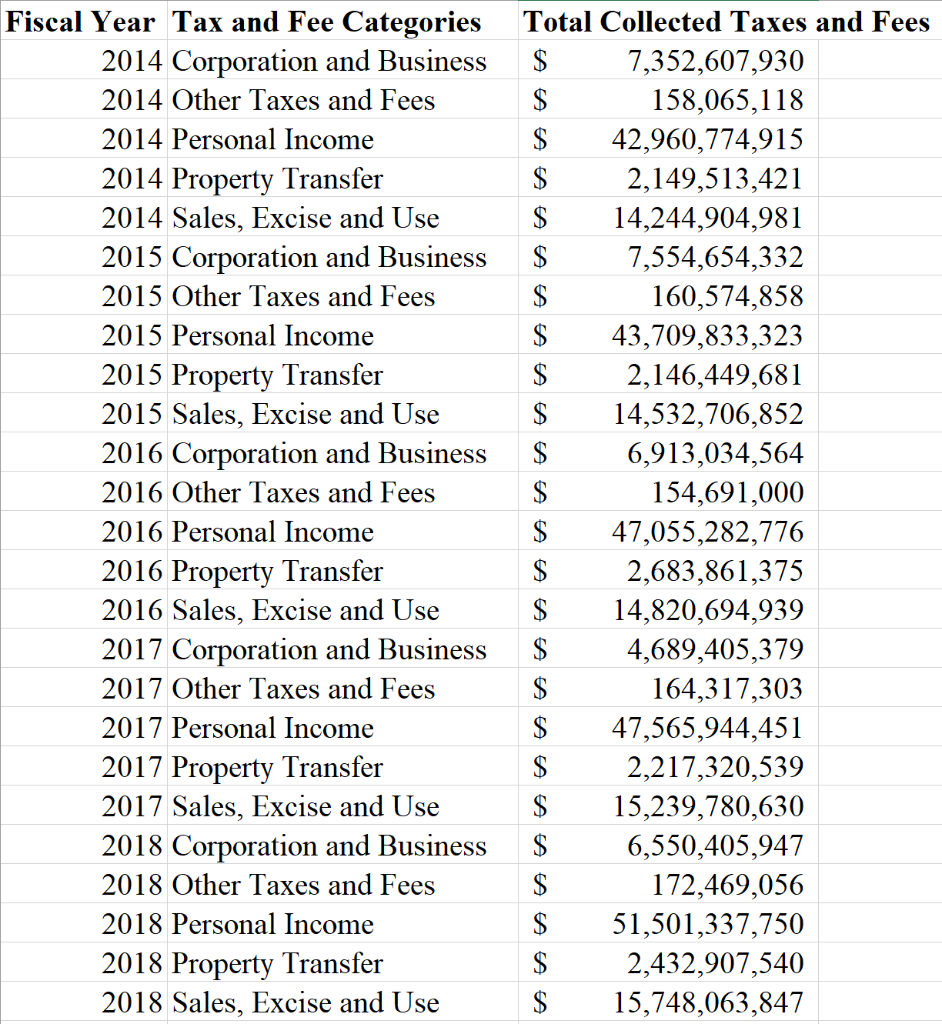
Fiscal Year Tax and Fee Categories Total Collected Taxes and Fees 2014 Corporation and Business 2014 Other Taxes and Fees $158,065,118 2014 Personal Income $42,960,774,915 2014 Property Transfer $2,149,513,421 2014 Sales, Excise and Use $14,244,904,981
Step by Step Solution
There are 3 Steps involved in it

Get step-by-step solutions from verified subject matter experts