

Question: Excel regression analysis for analytics class. Assignment - Excel Regression Analysis Directions. Answer the following sentences based upon your analysis. 1. After conducting a multiple
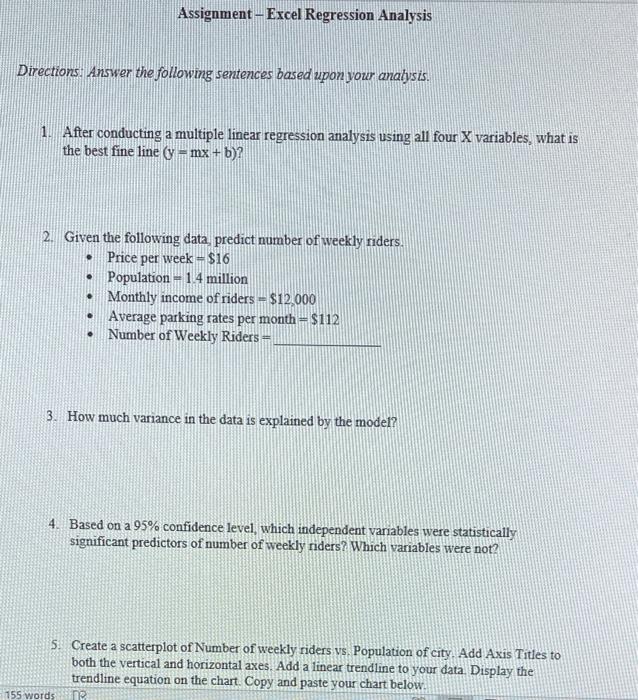
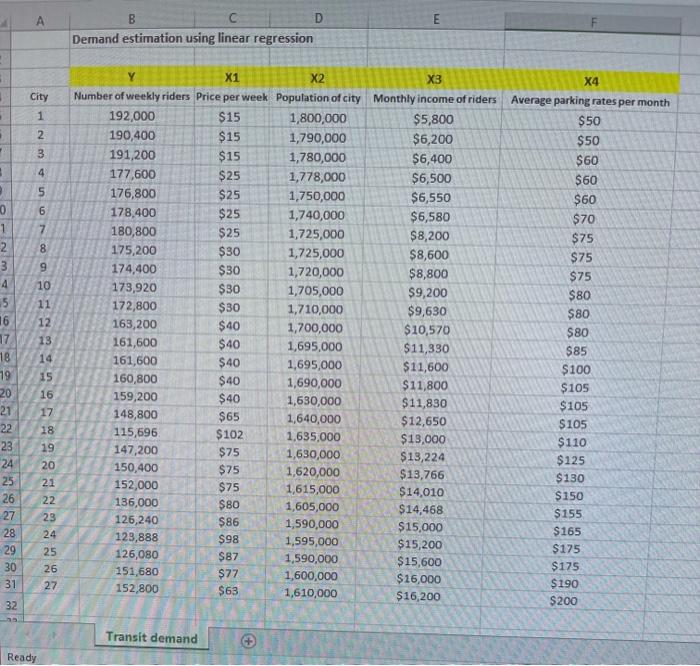
Assignment - Excel Regression Analysis Directions. Answer the following sentences based upon your analysis. 1. After conducting a multiple linear regression analysis using all four X variables, what is the best fine line (= mx + b)? . 2. Given the following data, predict number of weekly riders. Price per week - $16 Population = 1 4 million Monthly income of riders - $12.000 Average parking rates per month = $112 Number of Weekly Riders 3. How much variance in the data is explained by the model? 4. Based on a 95% confidence level, which independent variables were statistically significant predictors of number of weekly riders? Which variables were not? 5. Create a scatterplot of Number of weekly riders vs. Population of city. Add Axis Titles to both the vertical and horizontal axes. Add a linear trendline to your data. Display the trendline equation on the chart. Copy and paste your chart below. 155 words E C D Demand estimation using linear regression City 1 2 $50 3 4 $25 5 6 7 8 9 10 $30 11 12 13 0 1 2 3 4 5 16 17 18 19 20 21 22 23 24 25 26 27 28 29 30 31 X1 X2 3 X4 Number of weekly riders Price per week Population of city Monthly income of riders Average parking rates per month 192,000 $15 1,800,000 $5,800 $50 190,400 $15 1,790,000 $6,200 191,200 $15 1,780,000 $6,400 $60 177,600 1,778,000 $6,500 $60 176,800 $25 1,750,000 $6,550 $60 178,400 $25 1,740,000 $6,580 $70 180,800 $25 1,725,000 $8,200 $75 175,200 $30 1,725,000 $8,600 $75 174,400 $30 1,720,000 $8,800 $75 173,920 1,705,000 $9,200 $80 172,800 $30 1,710,000 $9,630 $80 163,200 $40 1,700,000 $10,570 $80 161,600 $40 1,695,000 $11,330 $85 161,600 $40 1,695,000 $11,600 $100 160,800 $40 1,690,000 $11,800 $105 159,200 $40 1,630,000 $11,830 $105 148,800 $65 1,640,000 $12,650 $105 115,696 $102 1,635,000 $13,000 $110 147,200 $75 1,630,000 $13,224 $125 150,400 $75 1,620,000 $13,766 $130 152,000 $75 1,615,000 $14,010 $150 136,000 1,605,000 $14,468 $155 126,240 $86 1,590,000 $15,000 $165 123,888 1,595,000 $15,200 $175 126,080 $87 1,590,000 $15,600 $175 151,680 $77 1,600,000 $16,000 $190 152,800 $63 1,610,000 $16,200 $200 14 15 16 17 18 19 20 $80 21 22 23 24 25 26 27 $98 32 Transit demand + Ready
Step by Step Solution
There are 3 Steps involved in it

Get step-by-step solutions from verified subject matter experts