

Question: PLEASE HELP ME IN FINDING SOLUTION TO THIS QUESTION Stat 4800 Assignment 2. Total marks: 1+ 11: 12 marks Please read these instructions carefully: write
PLEASE HELP ME IN FINDING SOLUTION TO THIS QUESTION
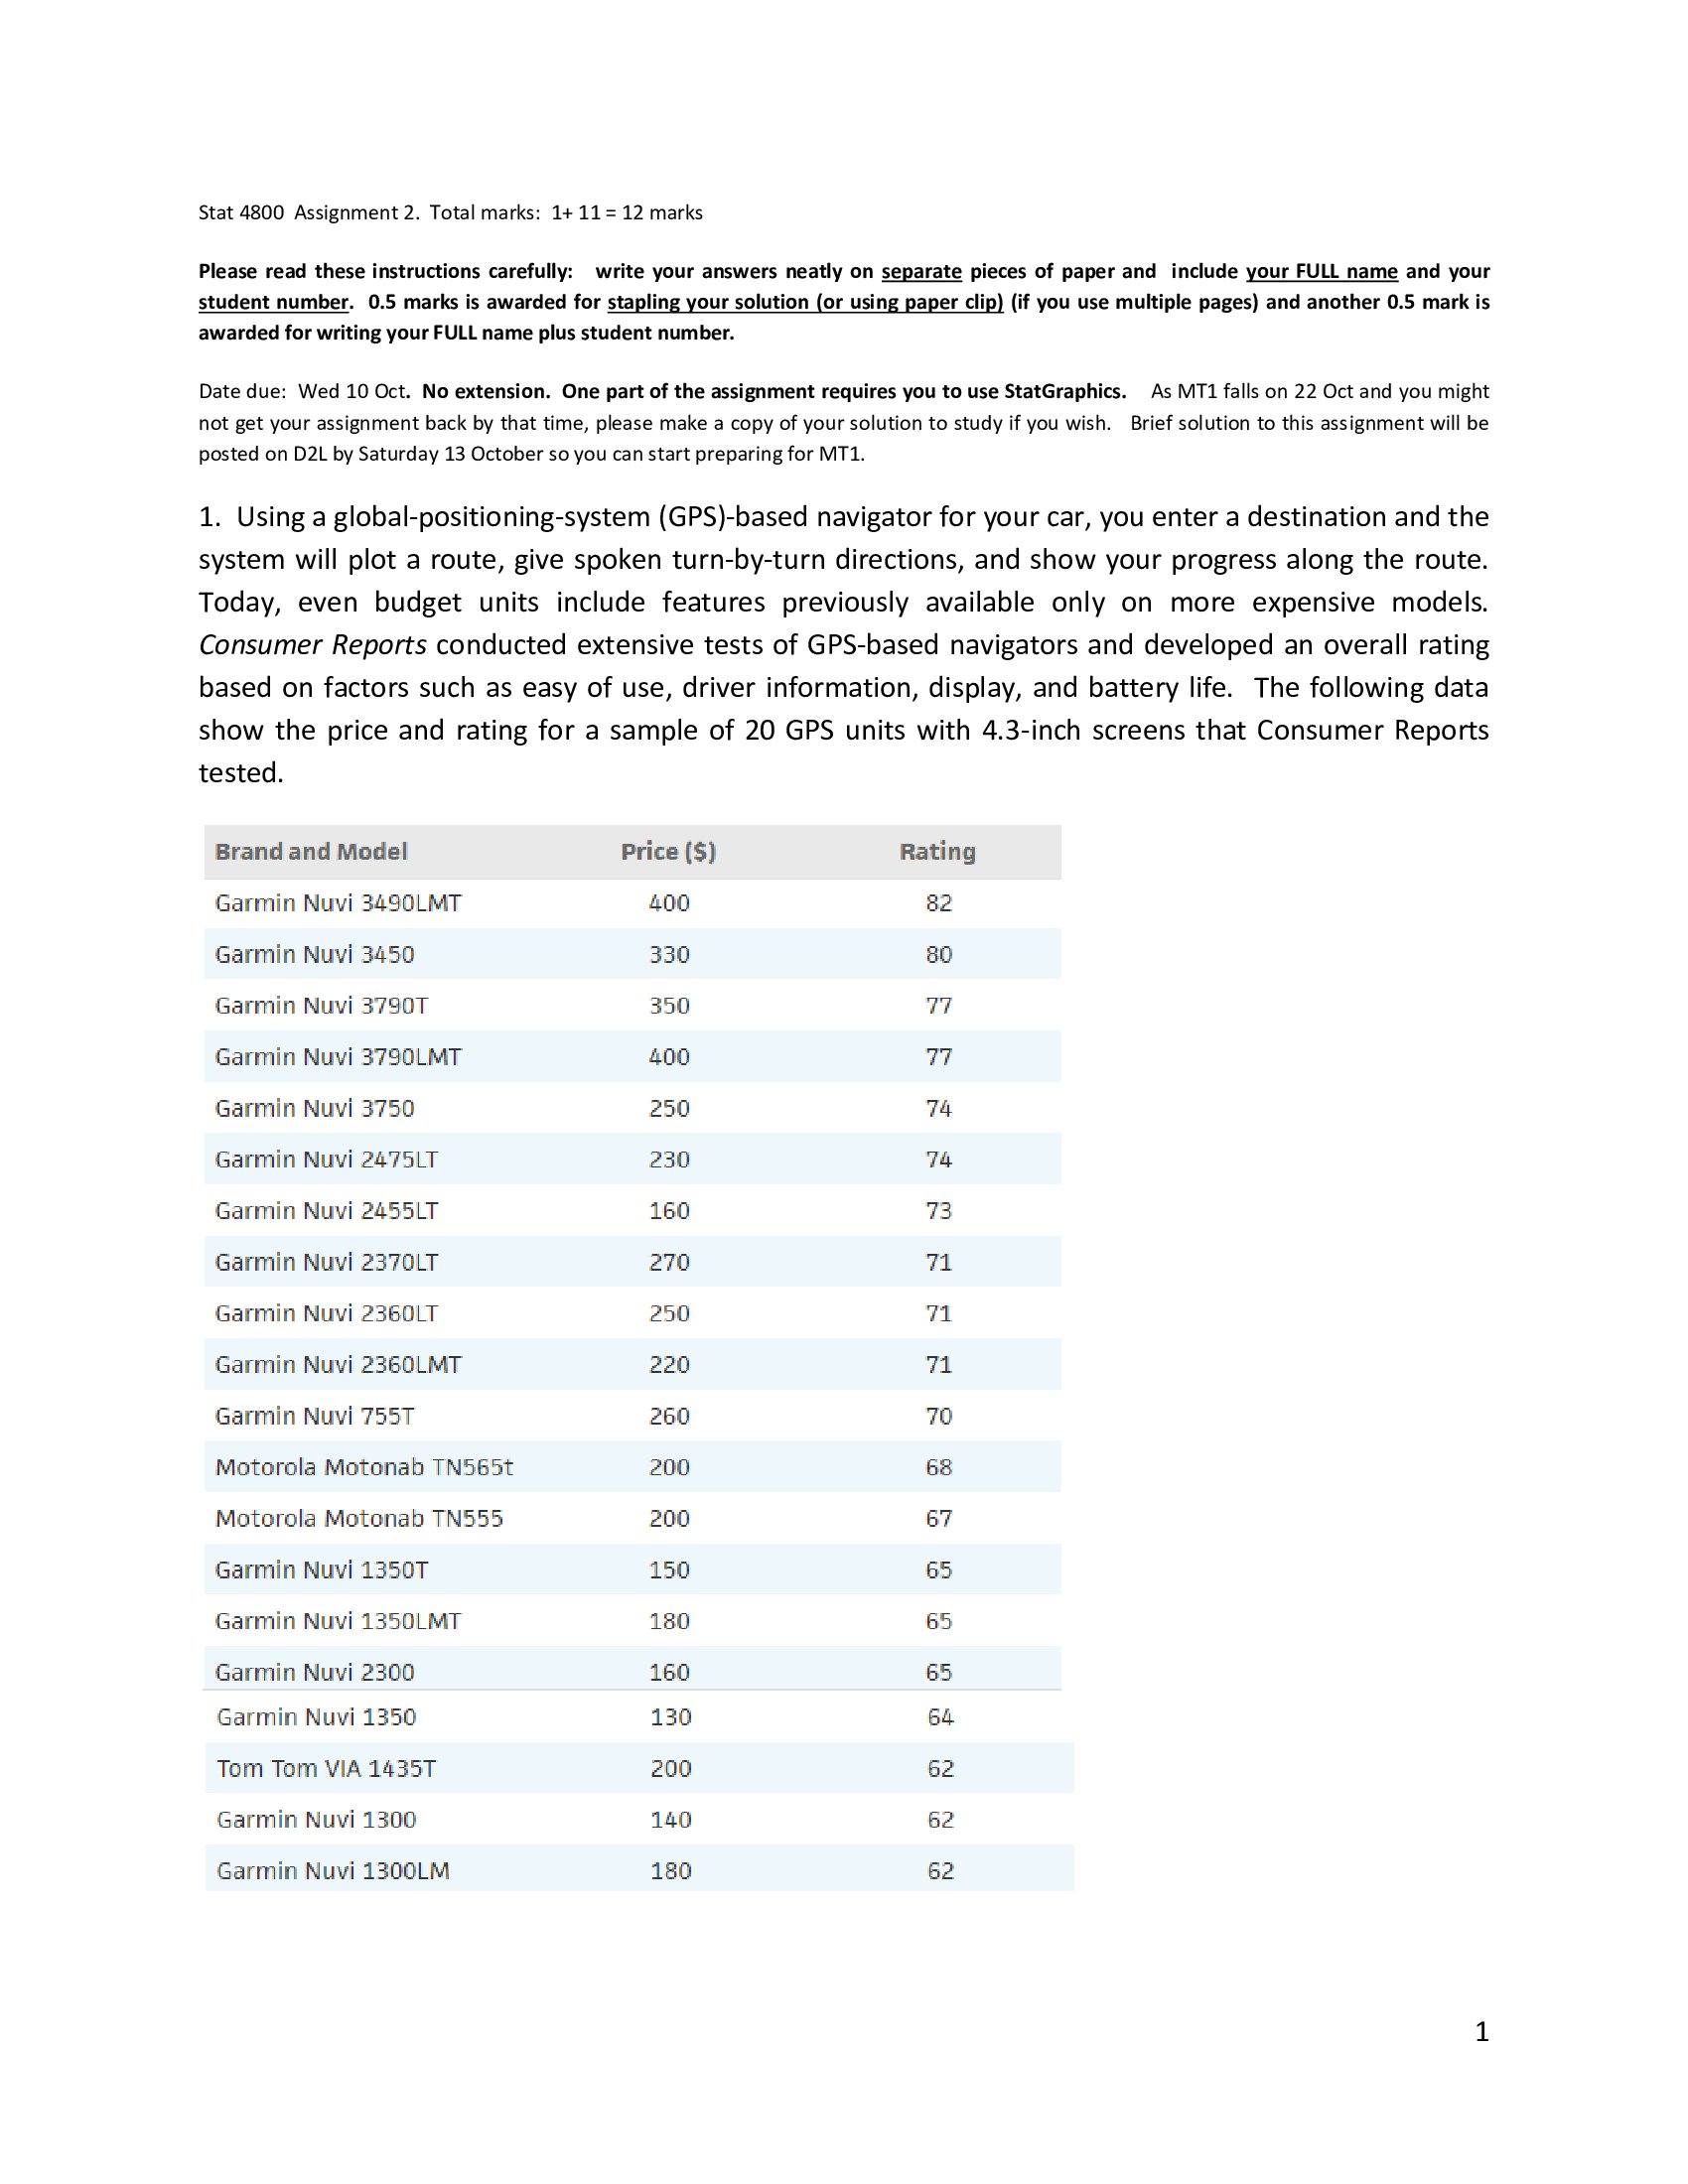
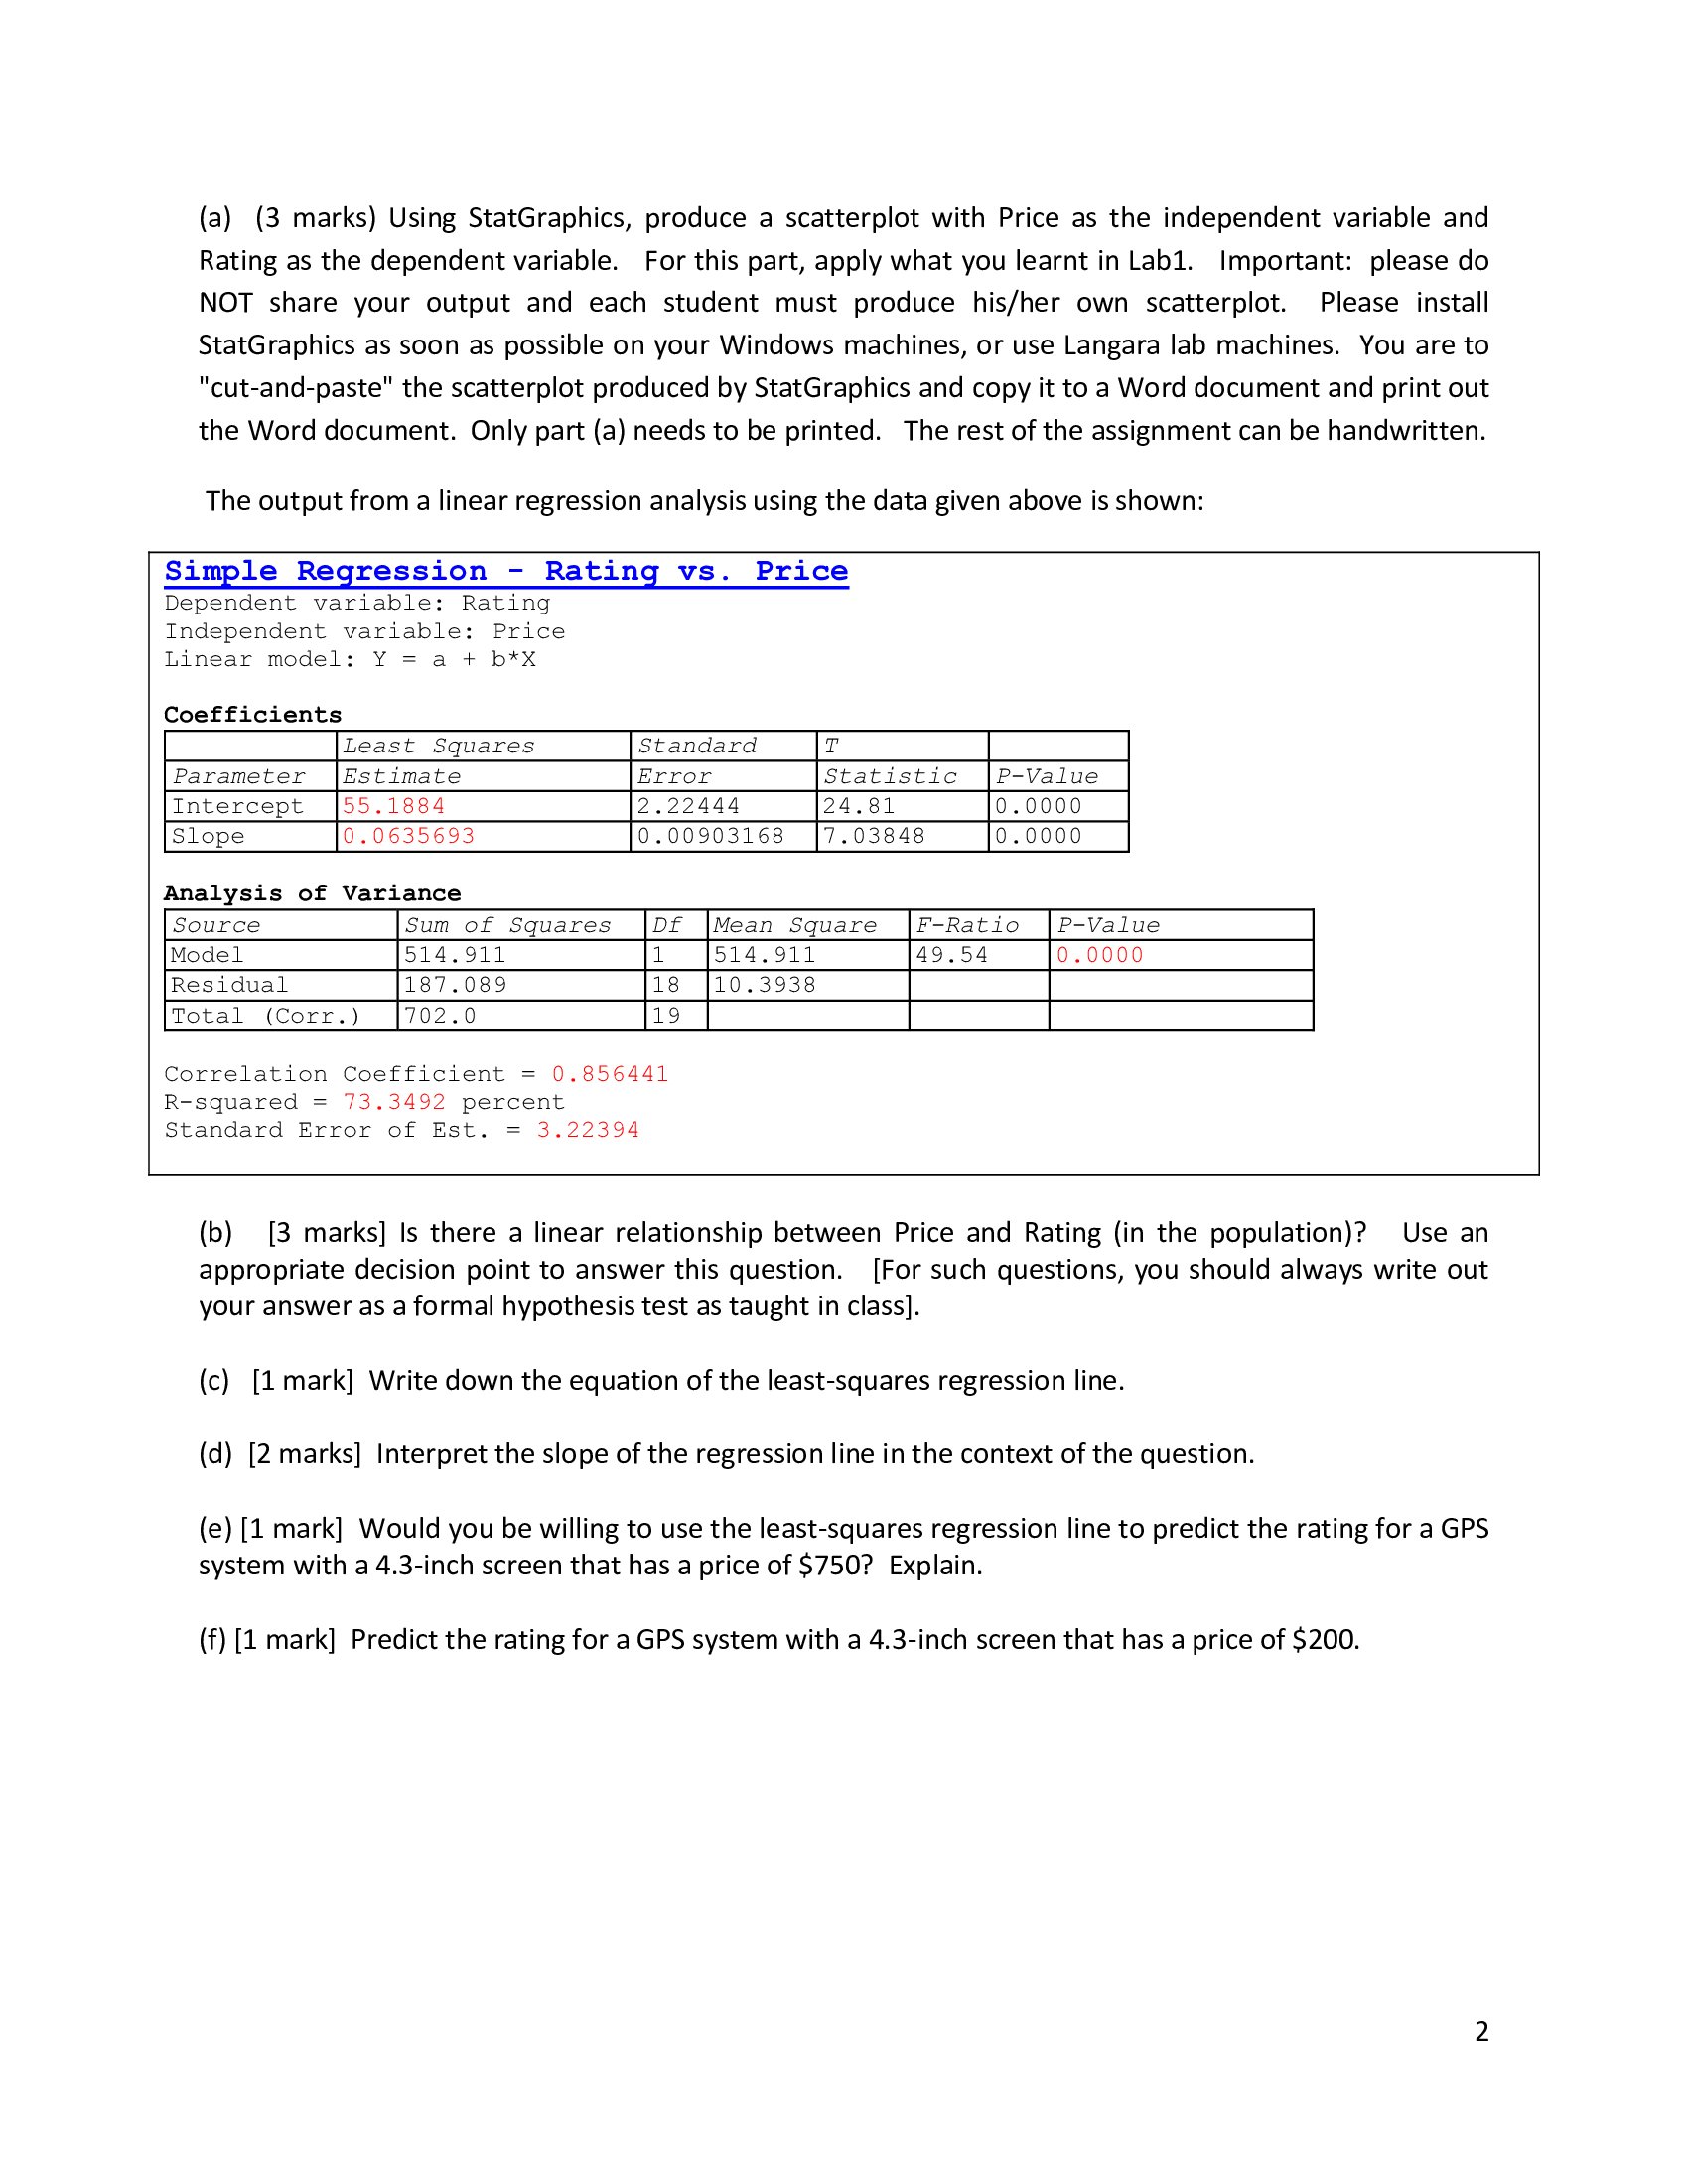
Stat 4800 Assignment 2. Total marks: 1+ 11: 12 marks Please read these instructions carefully: write your answers neatly on serate pieces of paper and include your FULL name and your student number. 0.5 marks is awarded for stapling_your solution (or using_paper clipl (if you use multiple pages) and another 0.5 mark is awarded for writing your FULL name plus student number. Date due: Wed 10 Oct. No extension. One part of the assignment requires you to use StatGraphics. As MT1 falls on 22 Oct and you might not get your assignment back by that time, please make a copy of your solution to study if you wish. Brief solution to this assignment will be posted on D2L by Saturday 13 October so you can start preparing for MT1. 1. Using a globalpositioningsystem (GPsl-based navigator for your car, you enter a destination and the system will plot a route, give spoken turnbyturn directions, and show your progress along the route. Today, even budget units include features previously available only on more expensive models. Consumer Reports conducted extensive tests of GPSbased navigators and deveIOped an overall rating based on factors such as easy of use, driver information, diSpIay, and battery life. The following data show the price and rating for a sample of 20 GPS units with 4.3inch screens that Consumer Reports tested. Brand and Model Price [5] Rating Garmin Nuv' BILBDLMT #00 82 Garmin Nuv' 3&50 330 80 lGarmin Nuv' new 351] 7'? Garmin Nuv' 3'3SDLMT #00 '77 Garmin Nuv' 3750 250 M Garmin Nuv' 2:175L" 230 7a Garmin Nuv' 2455? 150 73 Garmin Nuv' 237m" 270 T1 lGarmin Nuv' 2350K" 250 71 Garmin Nuv' EBBDLMT 220 71 Garmin Nuv' 755T 250 70 Motorola Motonab TNSEEt 201] 53 Motorola Motonab TNSES 200 57 Garmin Nuvi 135DT 150 55 Garmin Nuvi 1350LMT 180 I35 Garmin Nuvi 230i) 150 55 Garmin Nuvi135i3 130 55- Tom Tom VIA 11135T 200 52 lGarmin Nuvi 130!) 1A0 52 Garmin Nuvi IBDDLM 130 52 (a) (3 marks) Using StatGraphics, produce a scatterplot with Price as the independent variable and Rating as the dependent variable. For this part, apply what you learnt in Labl. Important: please do NOT share your output and each student must produce his/her own scatterplot. Please install StatGraphics as soon as possible on your Windows machines, or use Langara lab machines. You are to "Cutand-paste" the scatterplot produced by StatGraphics and copy it to a Word document and print out the Word document. Only part (a) needs to be printed. The rest of the assignment can be handwritten. The output from a linear regression analysis using the data given above is shown: Simgle Regression Rating vs. Price Dependent variable: Rating Independent variable: Price Linear model: Y = a + b*X Coefficients Least Squares Standard Statistic 55.1884 2.22444 24.81 0.0000 00635693 0.00903168 7.03848 0.0000 Analysis of Variance 8um of Squares 514.911-514.911 49.54 0.0000 1ev.oee-1o.393e Total (Co...) 702.0 - Correlation Coefficient = 0.856441 R-squared = 73.3492 percent Standard Error of Est. = 3.22394 (b) [3 marks] Is there a linear relationship between Price and Rating (in the population)? Use an appropriate decision point to answer this question. [For such questions, you should always write out your answer as a formal hypothesis test as taught in class]. (c) [1 mark] Write down the equation of the leastsquares regression line. (d) [2 marks] Interpret the slope of the regression line in the context of the question. (e) [1 mark] Would you be willing to use the leastSquares regression line to predict the rating for a GPS system with a 4.3-inch screen that has a price of $750? Explain. (f) [1 mark] Predict the rating for a GPS system with a 4.3-inch screen that has a price of $200
Step by Step Solution
There are 3 Steps involved in it

Get step-by-step solutions from verified subject matter experts