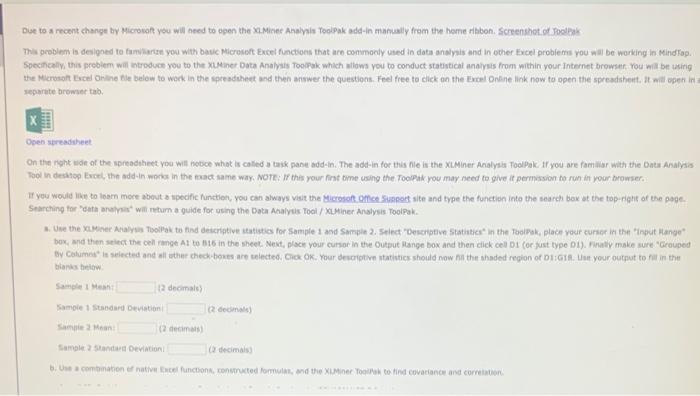
Question: excel spreadsheet Due to a recent change ty Microwet you will need to open the XaMinee Analyis Toopak add-in manualiy from the hame ribbon. Screnshot.
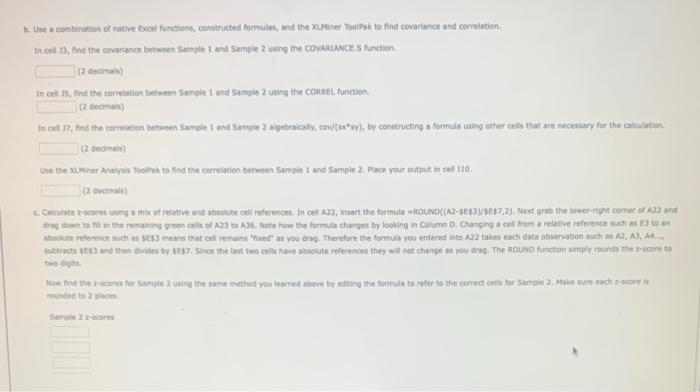
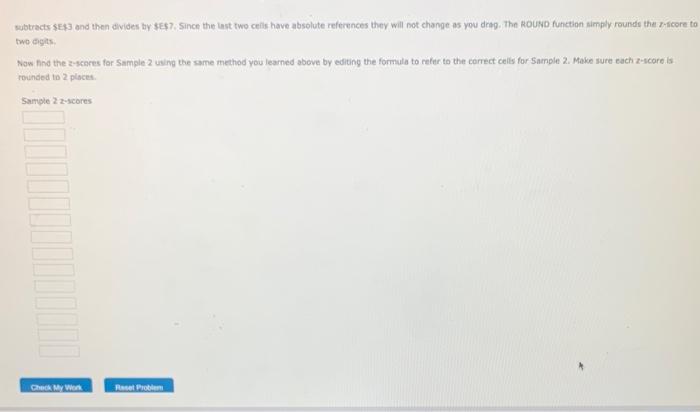
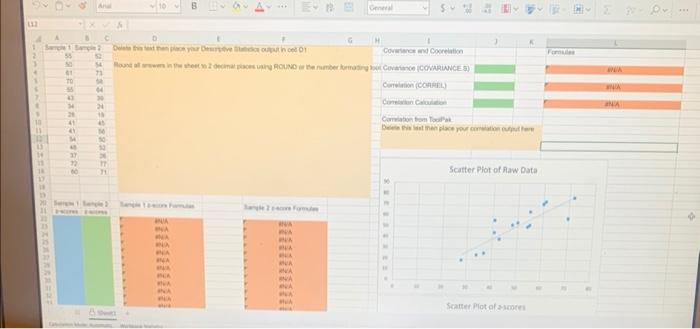
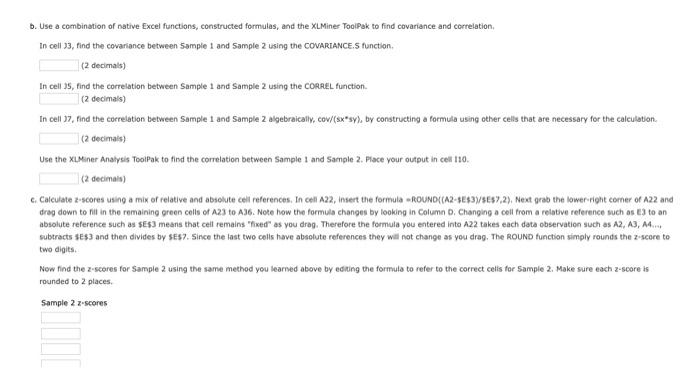
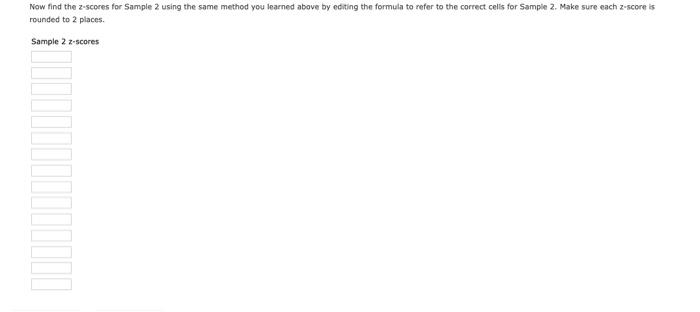
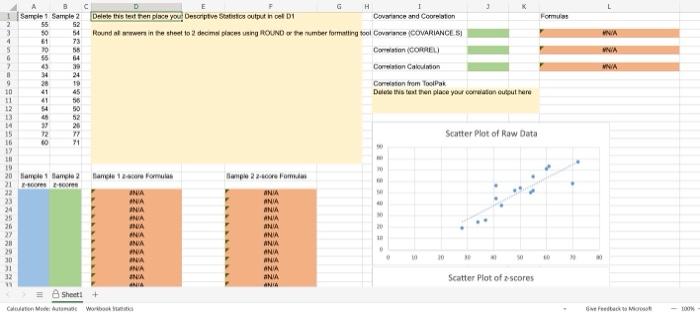
Due to a recent change ty Microwet you will need to open the XaMinee Analyis Toopak add-in manualiy from the hame ribbon. Screnshot. Ot Poolfak Specifcaly, this problem will entroduce you to the XUMiner Data Analysis Toopak whach wilowa you to conduct statistical anairsis from within your Internet browser. You was be using weparate browser tab. Osen streadheet On the ryht wide of the spreadtheet you will notoce whot is caled a task pane add-in. The add-in for this fle is the XiMiner Analysis ToolPak. If you are familar wath the Bata Analyis Searching for "cata aruinar" with return a guide for osing the Data Analytis Tool / Xutiner Aralysis Toolpak. blarks teltaw: b. Use a camberation of nathe Ercel functions, contructed formulat, and the XiMiner Toolsak to find covariance and correlation. In cril 33, find the covanance between Sample 1 and Sampin 2 using the COVARIMCE'S function. (2 decimals) In cell a5. find the correation between Sample 1 and Sample 2 using the Corlafl. function. (2 deconais) (2 deaimals) (2 decinals) arag town to fin in the remaking oreen ceils of A23 to A36. Note how the formes chonges by looking in Column 0 . Changing a cell from a relative reference suef as E3 to an twe digts. Foundine to 2 siacti. Sancele 2 z-scmint subtracts \$E\&3 and then dides by \$ES?; Since the inst fwo ceils have absolute references they will not change as you drag. The ROUND function simply roundf the r-feore to two degits. Now find the z-scores for Sample 2 using the same method you learned above by editing the formula to refer to the comect cells for 5ample2. Make sure each z-score is rounded to 2 places. Sample 2 zescores Due to a recent change by Microsoft you will need to open the XLMiner Analysis ToolPak add-in manually from the home ribbon. Screenstiot of ToolPak This problem is designed to familiarize you with basic Microsoft Excel functions that are commonly used in data analysis and in other Excel problems you will be working in MindTap. Specifically, this problem will introduce you to the XLMiner Data Analysis ToolPak which allows you to conduct statistical analysis frem within your tnternet browser, You will be using the Microsoft Excel Online file below to work in the spreadsheet and then answer the questions. Feel free to click on the Excel Online link now to open the spreadsheet. It will open in a separate browser tab. On the right side of the spreadsheet you will notice what is called a task pane add-in. The add-in for this file is the XLMiner Analysis ToolPak. If you are familar with the Data Analysis Tool in desktop Excel, the add in works in the exact same way. NOTE: If this your first time using the ToalPak you may need to give it permission to run in your browser. If you would like to learn more about a specific function, you can always visit the Microsoft. Office Support site and type the function into the search box at the top-right of the page. Searching for "data analysis" will return a gulde for using the Data Anaiysis Tool / xuminer Analysis ToolPak. a. Use the XLMiner Analysis ToolPak to find descriptive statistics for Sample 1 and Sample 2. Select "Descriptive Statistics" in the ToolPak, ploce your cursor in the "Input Range" box, and then select the cell range A1 to B16 in the sheet. Next, place your cursor in the Output Range box and then click cell D1 (or just type D1). Finally make sure "Grouped By Columns" is selected and all other check-boxes are selected. Click OK. Your descriptive statistics should now fill the shaded region of D1:G18. Use your output to fill in the blanics below. Sample 1 Mean: (2 decimals) Sample 1 Standard Deviation; (2 decimais) Sample 2 Mean: (2 decimais) Sample 2 Standard Deviation: (2 decimals) b. Use a combination of native Excel functions, constructed formulas, and the XLMiner ToolPak to find covariance and correlation. b. Use a combination of native Excel functions, constructed formulas, and the XLMiner TooiPak to find covariance and correlation. In cell 33, find the covariance between 5ample 1 and Sample 2 using the COVARIANCE.S function. (2 decimals) In cell 35, find the correlation between Sample 1 and Sample 2 using the CoAREL function. ( 2 decimals) In cell 37 , find the correlation between Sample 1 and Sample 2 algebraically, cow/(sx*sy), by constructing a formula using other cells that are necessary for the calculation. (2 decimais) Use the XLMiner Anatysis ToolPak to find the correlation between Sample 1 and Sample 2. Frace your output in cen It0. (2 decimais) c. Calculate z-scores using a mix of relative and absolute cel references. In cell A22, insert the formula =fDUND(A2-\$E\$3)/\$ES7,2), Next grab the lower-fight corner of A22 and drag down to fill in the remaining green cells of A23 to A36. Note how the formula changes by fooking in Column D. Changing a coll from a relative reference such as E3 to an absolute reference such as SE\$3 means that cell remains "fixed" as you drag. Therefore the formula you entered into A22 takes each data observation such as A2. A3, A4.ny subtracts 4E33 and then divides by SES7. Since the last two cells have absolute references they will not change as you drag. The ROUND function simply rounds the z'score to two digits. Now find the z-scores for Sample 2 using the same method you learned above by edning the formula to refer to the correct celis foe Sample 2 . Make sure each z-score is rounded to 2 places. Sample 2 z-sceres rounded to 2 places. Sample 2 z-scores