

Question: Excel spreadsheet is first screenshot Er_MS sd_MS Er) Er_XOM sd_XOM corr w 1.00 0.90 0.80 0.70 0.60 0.50 0.40 0.30 0.20 0.10 0.00 0.250 0.066
Excel spreadsheet is first screenshot
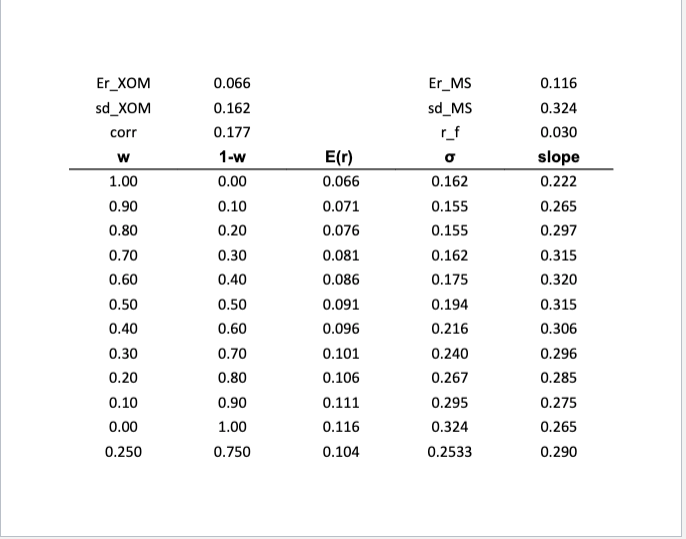
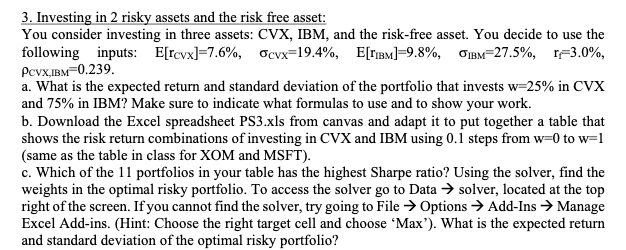
Er_MS sd_MS Er) Er_XOM sd_XOM corr w 1.00 0.90 0.80 0.70 0.60 0.50 0.40 0.30 0.20 0.10 0.00 0.250 0.066 0.162 0.177 1-w 0.00 0.10 0.20 0.30 0.40 0.066 0.071 0.076 0.081 0.086 0.091 0.096 0.116 0.324 0.030 slope 0.222 0.265 0.297 0.315 0.320 0.315 0.306 0.296 0.285 0.275 0.265 0.290 o 0.162 0.155 0.155 0.162 0.175 0.194 0.216 0.240 0.267 0.295 0.324 0.2533 0.50 0.60 0.70 0.101 0.80 0.90 0.106 0.111 0.116 1.00 0.750 0.104 3. Investing in 2 risky assets and the risk free asset: You consider investing in three assets: CVX, IBM, and the risk-free asset. You decide to use the following inputs: E[rcvx]=7.6%, Ocvx=19.4%, E[TiBm]=9.8%, BM=27.5%, r=3.0%, Pcvx IBM=0.239. a. What is the expected return and standard deviation of the portfolio that invests w=25% in CVX and 75% in IBM? Make sure to indicate what formulas to use and to show your work. b. Download the Excel spreadsheet PS3.xls from canvas and adapt it to put together a table that shows the risk return combinations of investing in CVX and IBM using 0.1 steps from w=0 to w=1 (same as the table in class for XOM and MSFT). c. Which of the 11 portfolios in your table has the highest Sharpe ratio? Using the solver, find the weights in the optimal risky portfolio. To access the solver go to Data solver, located at the top right of the screen. If you cannot find the solver, try going to File Options > Add-Ins Manage Excel Add-ins. (Hint: Choose the right target cell and choose "Max'). What is the expected return and standard deviation of the optimal risky portfolio? Er_MS sd_MS Er) Er_XOM sd_XOM corr w 1.00 0.90 0.80 0.70 0.60 0.50 0.40 0.30 0.20 0.10 0.00 0.250 0.066 0.162 0.177 1-w 0.00 0.10 0.20 0.30 0.40 0.066 0.071 0.076 0.081 0.086 0.091 0.096 0.116 0.324 0.030 slope 0.222 0.265 0.297 0.315 0.320 0.315 0.306 0.296 0.285 0.275 0.265 0.290 o 0.162 0.155 0.155 0.162 0.175 0.194 0.216 0.240 0.267 0.295 0.324 0.2533 0.50 0.60 0.70 0.101 0.80 0.90 0.106 0.111 0.116 1.00 0.750 0.104 3. Investing in 2 risky assets and the risk free asset: You consider investing in three assets: CVX, IBM, and the risk-free asset. You decide to use the following inputs: E[rcvx]=7.6%, Ocvx=19.4%, E[TiBm]=9.8%, BM=27.5%, r=3.0%, Pcvx IBM=0.239. a. What is the expected return and standard deviation of the portfolio that invests w=25% in CVX and 75% in IBM? Make sure to indicate what formulas to use and to show your work. b. Download the Excel spreadsheet PS3.xls from canvas and adapt it to put together a table that shows the risk return combinations of investing in CVX and IBM using 0.1 steps from w=0 to w=1 (same as the table in class for XOM and MSFT). c. Which of the 11 portfolios in your table has the highest Sharpe ratio? Using the solver, find the weights in the optimal risky portfolio. To access the solver go to Data solver, located at the top right of the screen. If you cannot find the solver, try going to File Options > Add-Ins Manage Excel Add-ins. (Hint: Choose the right target cell and choose "Max'). What is the expected return and standard deviation of the optimal risky portfolio
Step by Step Solution
There are 3 Steps involved in it

Get step-by-step solutions from verified subject matter experts