

Question: Excel templates are not needed to answer this question. Latest financial data for Apple Inc. is provided below. Apple Inc. 2020 2019 Balance Sheet (all
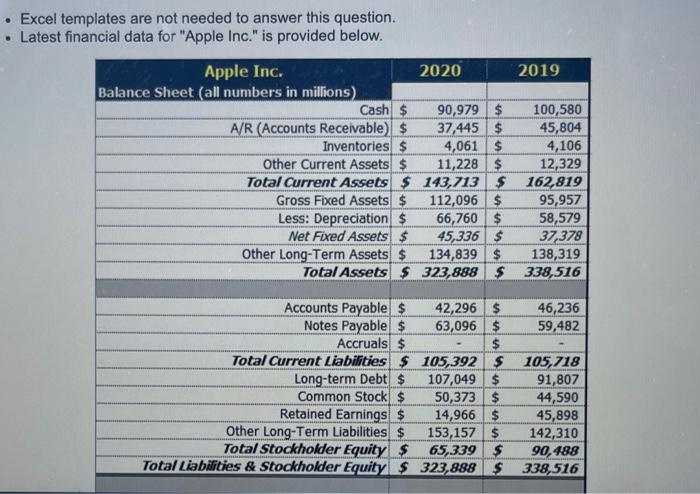
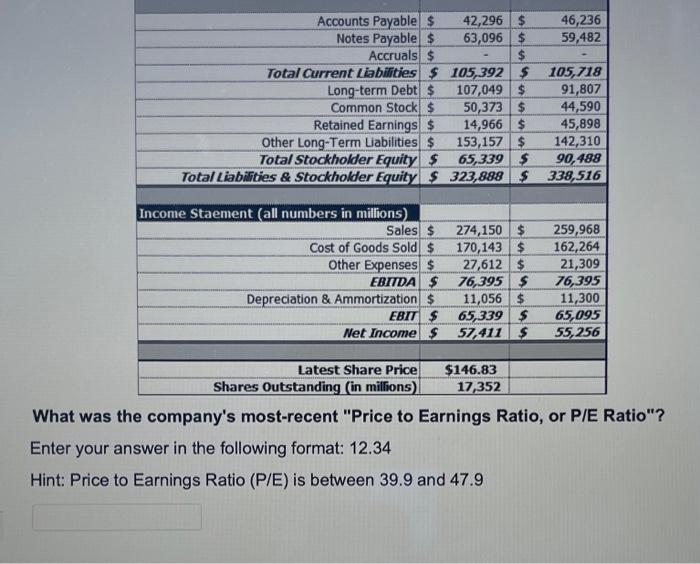
Excel templates are not needed to answer this question. Latest financial data for "Apple Inc." is provided below. Apple Inc. 2020 2019 Balance Sheet (all numbers in millions) Cash $ 90,979 $ 100,580 A/R (Accounts Receivable) $ 37,445 $ 45,804 Inventories $ 4,061 $ 4,106 Other Current Assets $ 11,228 $ 12,329 Total Current Assets $ 143,713 $ 162,819 Gross Fixed Assets $ 112,096 $ 95,957 Less: Depreciation $ 66,760 $ 58,579 Net Fixed Assets $ 45,336 $ 37,378 Other Long-Term Assets $ 134,839 $ 138,319 Total Assets $ 323,888 $ 338,516 Accounts Payable $ 42,296 $ 46,236 Notes Payable $ 63,096 $ 59,482 Accruals $ $ Total Current Liabilities $ 105,392 $ 105,718 Long-term Debt $ 107,049 $ 91,807 Common Stock $ 50,373 $ 44,590 Retained Earnings $ 14,966 $ 45,898 Other Long-Term Liabilities $ 153,157 $ 142,310 Total Stockholder Equity $ 65,3395 90,488 Total Liabilities & Stockholder Equity s 323,888 S 338,516 Accounts Payable $ 42,296 $ 46,236 Notes Payable $ 63,096 $ 59,482 Accruals $ $ Total Current Liabilities $ 105,392 $ 105,718 Long-term Debts 107,049 $ 91,807 Common Stock $ 50,373 $ 44,590 Retained Earnings $ 14,966 $ 45,898 Other Long-Term Liabilities $ 153,157 $ 142,310 Total Stockholder Equity $ 65,339 $ 90,488 Total Liabilities & Stockholder Equity $ 323,888 $ 338,516 Income Staement (all numbers in millions) Sales $ 274,150 $ Cost of Goods Sold $ 170,143 $ Other Expenses $ 27,612 $ EBITDA S 76,395 $ Depreciation & Ammortization $ 11,056 $ EBIT $ 65,339 $ Net Income $ 57,411 S 259,968 162,264 21,309 76,395 11,300 65,095 55,256 Latest Share Price $146.83 Shares Outstanding (in millions) 17,352 What was the company's most-recent "Price to Earnings Ratio, or P/E Ratio"? Enter your answer in the following format: 12.34 Hint: Price to Earnings Ratio (P/E) is between 39.9 and 47.9
Step by Step Solution
There are 3 Steps involved in it

Get step-by-step solutions from verified subject matter experts