

Question: MBA 8070, Case 2: Valuation Use the provided financial data on Apple, Inc. (AAPL) to value the firm's equity. Document all of the assumptions you
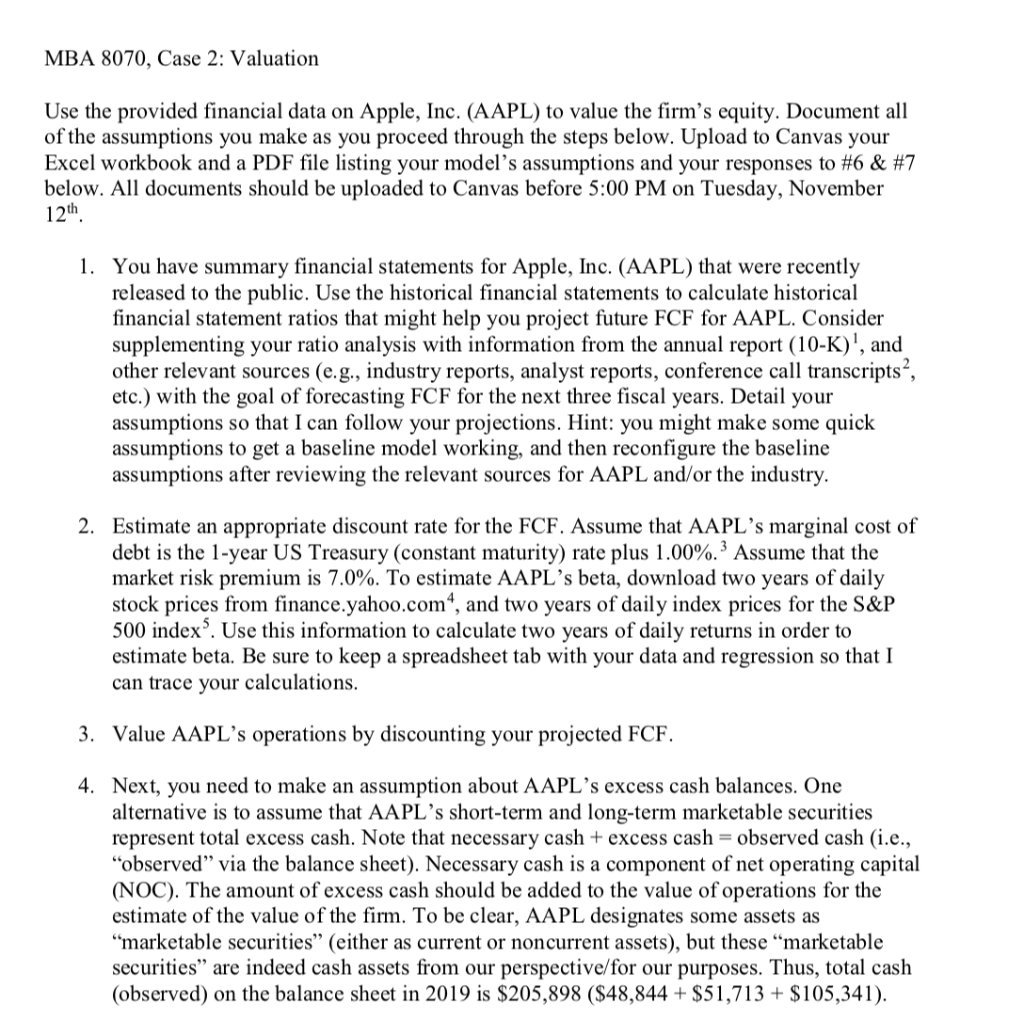
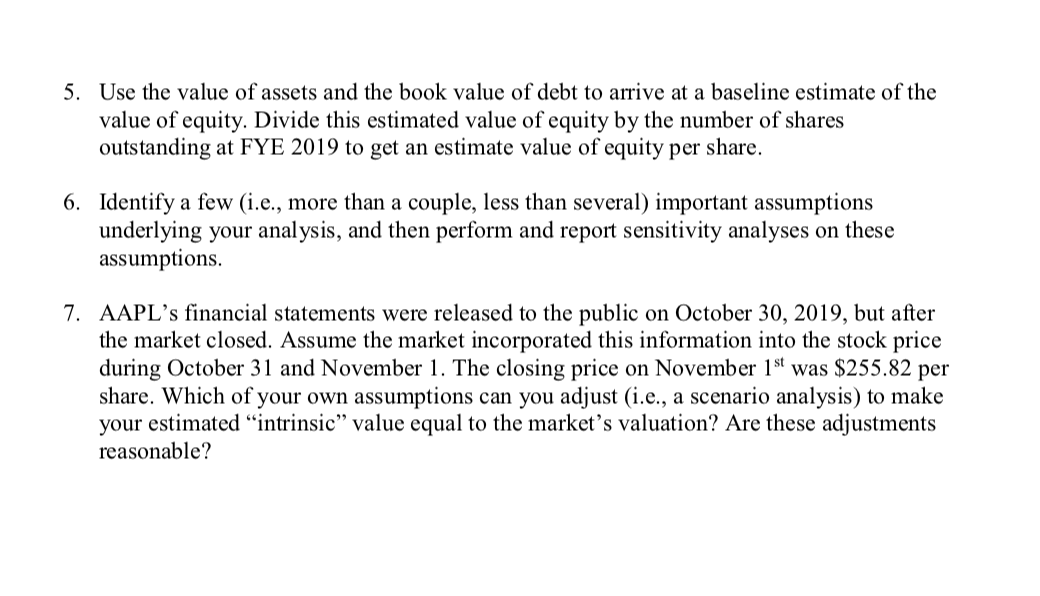
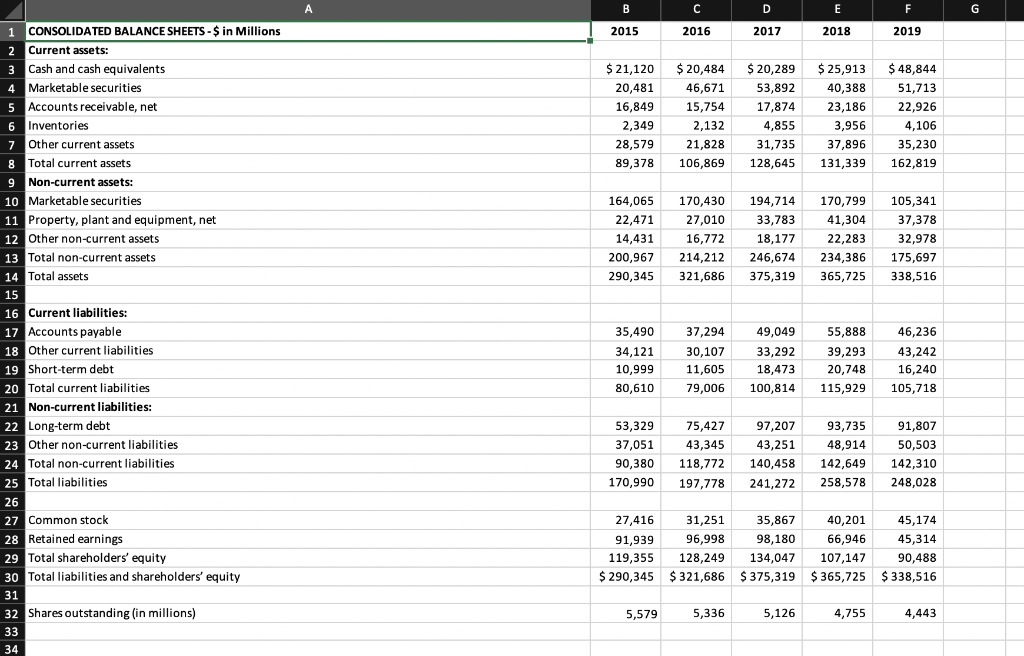
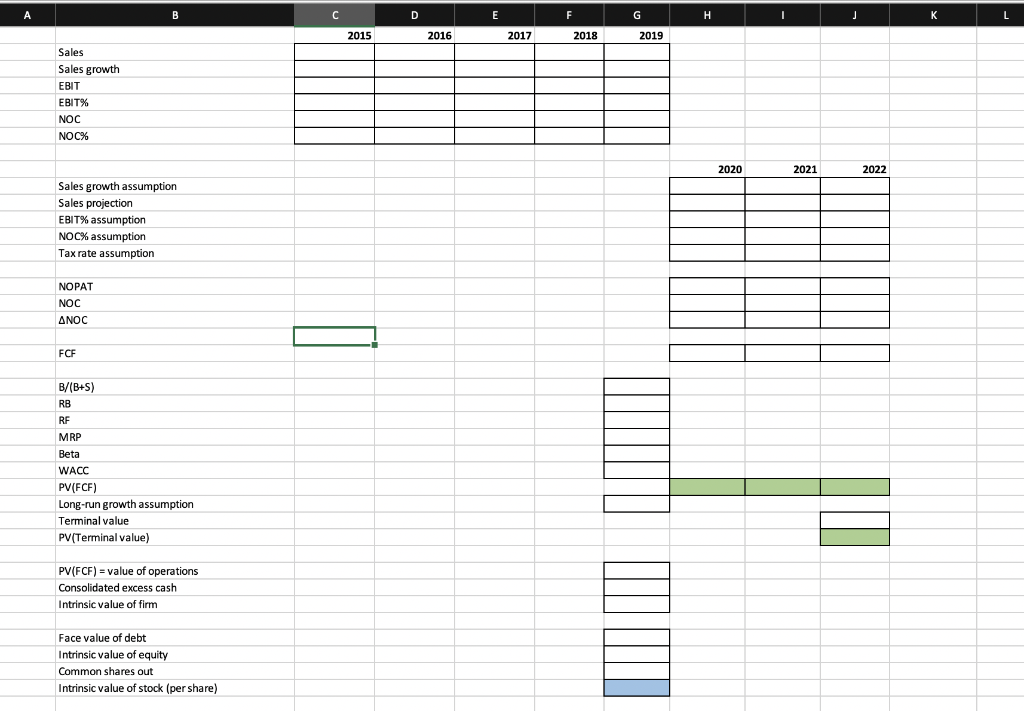
MBA 8070, Case 2: Valuation Use the provided financial data on Apple, Inc. (AAPL) to value the firm's equity. Document all of the assumptions you make as you proceed through the steps below. Upload to Canvas your Excel workbook and a PDF file listing your model's assumptions and your responses to #6 & #7 below. All documents should be uploaded to Canvas before 5:00 PM on Tuesday, November 12th 1. You have summary financial statements for Apple, Inc. (AAPL) that were recently released to the public. Use the historical financial statements to calculate historical financial statement ratios that might help you project future FCF for AAPL. Consider supplementing your ratio analysis with information from the annual report (10-K)', and other relevant sources (e.g., industry reports, analyst reports, conference call transcripts*, etc.) with the goal of forecasting FCF for the next three fiscal years. Detail your assumptions so that I can follow your projections. Hint: you might make some quick assumptions to get a baseline model working, and then reconfigure the baseline assumptions after reviewing the relevant sources for AAPL and/or the industry 2. Estimate an appropriate discount rate for the FCF. Assume that AAPL's marginal cost of debt is the 1-year US Treasury (constant maturity) rate plus 1.00%.3 Assume that the market risk premium is 7.0%. To estimate AAPL's beta, download two years of daily stock prices from finance.yahoo.com4, and two years of daily index prices for the S&P 500 index Use this information to calculate two years of daily returns in order to estimate beta. Be sure to keep a spreadsheet tab with your data and regression so that I can trace your calculations 3. Value AAPL's operations by discounting your projected FCF 4. Next, you need to make an assumption about AAPL's excess cash balances. One alternative is to assume that AAPL's short-term and long-term marketable securities represent total excess cash. Note that necessary cash + excess cash = observed cash (i.e. "observed" via the balance sheet). Necessary cash is a component of net operating capital (NOC). The amount of excess cash should be added to the value of operations for the estimate of the value of the firm. To be clear, AAPL designates some assets as "marketable securities" (either as current or noncurrent assets), but these "marketable securities" are indeed cash assets from our perspective/for our purposes. Thus, total cash (observed) on the balance sheet in 2019 is $205,898 ($48,844 + $51,713 + $105,341). 5. Use the value of assets and the book value of debt to arrive at a baseline estimate of the value of equity. Divide this estimated value of equity by the number of shares outstanding at FYE 2019 to get an estimate value of equity per share 6. Identify a few (i.e., more than a couple, less than several) important assumptions underlying your analysis, and then perform and report sensitivity analyses on these assumptions 7. AAPL's financial statements were released to the public on October 30, 2019, but after the market closed. Assume the market incorporated this information into the stock price during October 31 and November 1. The closing price on November 1st was $255.82 per share. Which of your own assumptions can you adjust (i.e., a scenario analysis) to make your estimated "intrinsic" value equal to the market's valuation? Are these adjustments reasonable? A C F G CONSOLIDATED BALANCE SHEETS-$ in Millions 2018 2015 2016 2017 2019 1 Current assets: 3 Cash and cash equivalents $ 20,484 $ 25,913 $21,120 $20,289 $ 48,844 4 Marketable securities 5 Accounts receivable, net 6 Inventories 53,892 20,481 46,671 40,388 51,713 16,849 15,754 17,874 23,186 22,926 2,349 4,855 2,132 3,956 4,106 7 Other current assets 28,579 35,230 21,828 31,735 37,896 8 Total current assets 9 Non-current assets: 10 Marketable securities 106,869 131,339 89,378 128,645 162,819 164,065 170,430 194,714 105,341 170,799 11 Property, plant and equipment, net 12 Other non-current assets 22,471 27,010 33,783 41,304 37,378 14,431 16,772 18,177 22,283 32,978 13 Total non-current assets 14 Total assets 200,967 175,697 214,212 246,674 234,386 375,319 290,345 321,686 365,725 338,516 15 16 Current liabilities: 17 Accounts payable 18 Other current liabilities 37,294 35,490 49,049 55,888 46,236 34,121 33,292 30,107 39,293 43,242 19 Short-term debt 11,605 20,748 10,999 18,473 16,240 20 Total current liabilities 21 Non-current liabilities: 115,929 80,610 79,006 100,814 105,718 22 Long-term debt 53,329 75,427 97,207 93,735 91,807 23 Other non-current liabilities 37,051 43,345 43,251 48,914 50.503 24 Total non-current liabilities 25 Total liabilities 90,380 118,772 140,458 142,649 142,310 241,272 170,990 258,578 248,028 197,778 26 27 Common stock 28 Retained earnings 35,867 27,416 31,251 40,201 45,174 96,998 98,180 66,946 91,939 45,314 29 Total shareholders' equity 30 Total liabilities and shareholders' equity 128,249 119,355 134,047 107,147 90,488 $290,345 $321,686 $375,319 $365,725 $338,516 31 32 Shares outstanding (in millions) 4,755 5,336 5,126 4,443 5,579 33 34 A B C E F G H L 2015 2016 2017 2018 2019 Sales Sales growth EBIT EBIT% NOC NOC% 2020 2021 2022 Sales growth assumption Sales projection EBIT% assumption NOC% assumption Tax rate assumption NOPAT NOC ANOC FCP B/(B+S) RB RF MRP Beta WACC PV(FCF) Long-run growth assumption Terminal value PV(Terminal value) PV(FCF) value of operations Consolidated excess cash Intrinsic value of firm Face value of debt Intrinsic value of equity Common shares out Intrinsic value of stock (per share) MBA 8070, Case 2: Valuation Use the provided financial data on Apple, Inc. (AAPL) to value the firm's equity. Document all of the assumptions you make as you proceed through the steps below. Upload to Canvas your Excel workbook and a PDF file listing your model's assumptions and your responses to #6 & #7 below. All documents should be uploaded to Canvas before 5:00 PM on Tuesday, November 12th 1. You have summary financial statements for Apple, Inc. (AAPL) that were recently released to the public. Use the historical financial statements to calculate historical financial statement ratios that might help you project future FCF for AAPL. Consider supplementing your ratio analysis with information from the annual report (10-K)', and other relevant sources (e.g., industry reports, analyst reports, conference call transcripts*, etc.) with the goal of forecasting FCF for the next three fiscal years. Detail your assumptions so that I can follow your projections. Hint: you might make some quick assumptions to get a baseline model working, and then reconfigure the baseline assumptions after reviewing the relevant sources for AAPL and/or the industry 2. Estimate an appropriate discount rate for the FCF. Assume that AAPL's marginal cost of debt is the 1-year US Treasury (constant maturity) rate plus 1.00%.3 Assume that the market risk premium is 7.0%. To estimate AAPL's beta, download two years of daily stock prices from finance.yahoo.com4, and two years of daily index prices for the S&P 500 index Use this information to calculate two years of daily returns in order to estimate beta. Be sure to keep a spreadsheet tab with your data and regression so that I can trace your calculations 3. Value AAPL's operations by discounting your projected FCF 4. Next, you need to make an assumption about AAPL's excess cash balances. One alternative is to assume that AAPL's short-term and long-term marketable securities represent total excess cash. Note that necessary cash + excess cash = observed cash (i.e. "observed" via the balance sheet). Necessary cash is a component of net operating capital (NOC). The amount of excess cash should be added to the value of operations for the estimate of the value of the firm. To be clear, AAPL designates some assets as "marketable securities" (either as current or noncurrent assets), but these "marketable securities" are indeed cash assets from our perspective/for our purposes. Thus, total cash (observed) on the balance sheet in 2019 is $205,898 ($48,844 + $51,713 + $105,341). 5. Use the value of assets and the book value of debt to arrive at a baseline estimate of the value of equity. Divide this estimated value of equity by the number of shares outstanding at FYE 2019 to get an estimate value of equity per share 6. Identify a few (i.e., more than a couple, less than several) important assumptions underlying your analysis, and then perform and report sensitivity analyses on these assumptions 7. AAPL's financial statements were released to the public on October 30, 2019, but after the market closed. Assume the market incorporated this information into the stock price during October 31 and November 1. The closing price on November 1st was $255.82 per share. Which of your own assumptions can you adjust (i.e., a scenario analysis) to make your estimated "intrinsic" value equal to the market's valuation? Are these adjustments reasonable? A C F G CONSOLIDATED BALANCE SHEETS-$ in Millions 2018 2015 2016 2017 2019 1 Current assets: 3 Cash and cash equivalents $ 20,484 $ 25,913 $21,120 $20,289 $ 48,844 4 Marketable securities 5 Accounts receivable, net 6 Inventories 53,892 20,481 46,671 40,388 51,713 16,849 15,754 17,874 23,186 22,926 2,349 4,855 2,132 3,956 4,106 7 Other current assets 28,579 35,230 21,828 31,735 37,896 8 Total current assets 9 Non-current assets: 10 Marketable securities 106,869 131,339 89,378 128,645 162,819 164,065 170,430 194,714 105,341 170,799 11 Property, plant and equipment, net 12 Other non-current assets 22,471 27,010 33,783 41,304 37,378 14,431 16,772 18,177 22,283 32,978 13 Total non-current assets 14 Total assets 200,967 175,697 214,212 246,674 234,386 375,319 290,345 321,686 365,725 338,516 15 16 Current liabilities: 17 Accounts payable 18 Other current liabilities 37,294 35,490 49,049 55,888 46,236 34,121 33,292 30,107 39,293 43,242 19 Short-term debt 11,605 20,748 10,999 18,473 16,240 20 Total current liabilities 21 Non-current liabilities: 115,929 80,610 79,006 100,814 105,718 22 Long-term debt 53,329 75,427 97,207 93,735 91,807 23 Other non-current liabilities 37,051 43,345 43,251 48,914 50.503 24 Total non-current liabilities 25 Total liabilities 90,380 118,772 140,458 142,649 142,310 241,272 170,990 258,578 248,028 197,778 26 27 Common stock 28 Retained earnings 35,867 27,416 31,251 40,201 45,174 96,998 98,180 66,946 91,939 45,314 29 Total shareholders' equity 30 Total liabilities and shareholders' equity 128,249 119,355 134,047 107,147 90,488 $290,345 $321,686 $375,319 $365,725 $338,516 31 32 Shares outstanding (in millions) 4,755 5,336 5,126 4,443 5,579 33 34 A B C E F G H L 2015 2016 2017 2018 2019 Sales Sales growth EBIT EBIT% NOC NOC% 2020 2021 2022 Sales growth assumption Sales projection EBIT% assumption NOC% assumption Tax rate assumption NOPAT NOC ANOC FCP B/(B+S) RB RF MRP Beta WACC PV(FCF) Long-run growth assumption Terminal value PV(Terminal value) PV(FCF) value of operations Consolidated excess cash Intrinsic value of firm Face value of debt Intrinsic value of equity Common shares out Intrinsic value of stock (per share)
Step by Step Solution
There are 3 Steps involved in it

Get step-by-step solutions from verified subject matter experts