

Question: Excel. Use of interpolation and forecast to create a plot. Please show the details of creating the plot. not just the final answer. (25 points)
 Excel. Use of interpolation and forecast to create a plot. Please show the details of creating the plot. not just the final answer.
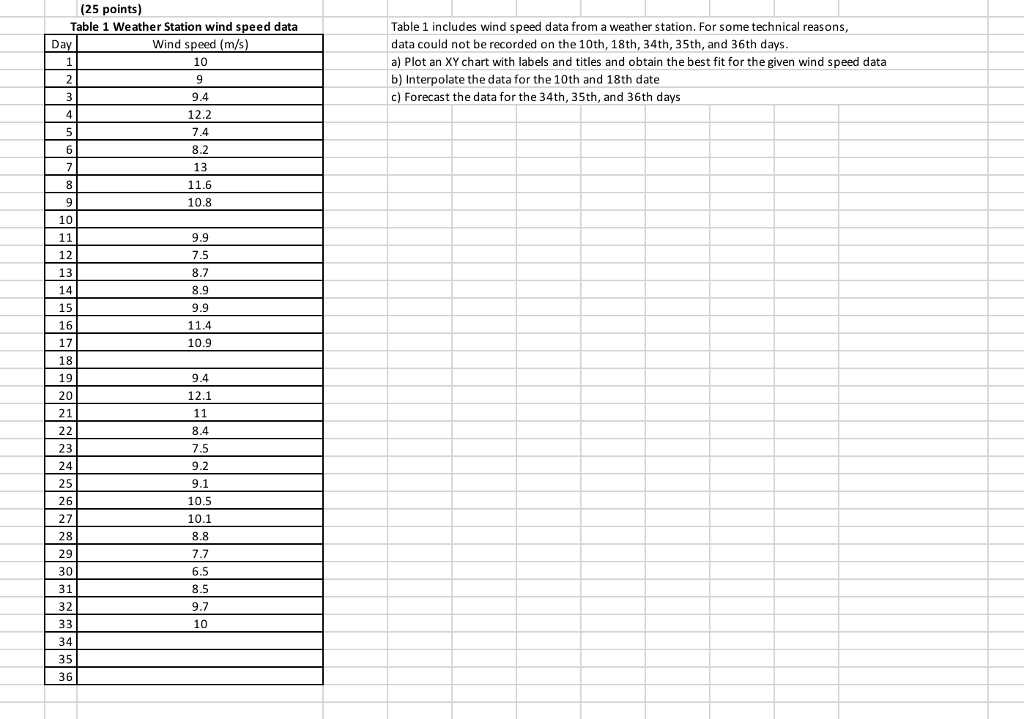
(25 points) Table 1 Weather Station wind speed data Table 1 includes wind speed data from a weather station. For some technical reasons data could not be recorded on the 10th, 18th, 34th, 35th, and 36th days a) Plot an XY chart with labels and titles and obtain the best fit for the given wind speed data b) Interpolate the data for the 10th and 18th date c) Forecast the data for the 34th, 35th, and 36th days Wind speed (m/s) 10 Da 9.4 12.2 7.4 8.2 13 11.6 10.8 10 9.9 7.5 8.7 8.9 9.9 11.4 10.9 13 15 17 18 19 20 21 9.4 12.1 23 24 25 26 27 28 29 30 31 32 8.4 7.5 9.2 9.1 10.5 10.1 8.8 7.7 6.5 8.5 9.7 10 34 36 (25 points) Table 1 Weather Station wind speed data Table 1 includes wind speed data from a weather station. For some technical reasons data could not be recorded on the 10th, 18th, 34th, 35th, and 36th days a) Plot an XY chart with labels and titles and obtain the best fit for the given wind speed data b) Interpolate the data for the 10th and 18th date c) Forecast the data for the 34th, 35th, and 36th days Wind speed (m/s) 10 Da 9.4 12.2 7.4 8.2 13 11.6 10.8 10 9.9 7.5 8.7 8.9 9.9 11.4 10.9 13 15 17 18 19 20 21 9.4 12.1 23 24 25 26 27 28 29 30 31 32 8.4 7.5 9.2 9.1 10.5 10.1 8.8 7.7 6.5 8.5 9.7 10 34 36
Step by Step Solution
There are 3 Steps involved in it

Get step-by-step solutions from verified subject matter experts