

Question: Excel, Use the cash flows below to create a data table showing IRR sensitivity due to changes in Annual NOI Growth and Exit Cap Rate.
Excel, Use the cash flows below to create a data table showing IRR sensitivity due to changes in Annual NOI Growth and Exit Cap Rate. please show work/formulas if possible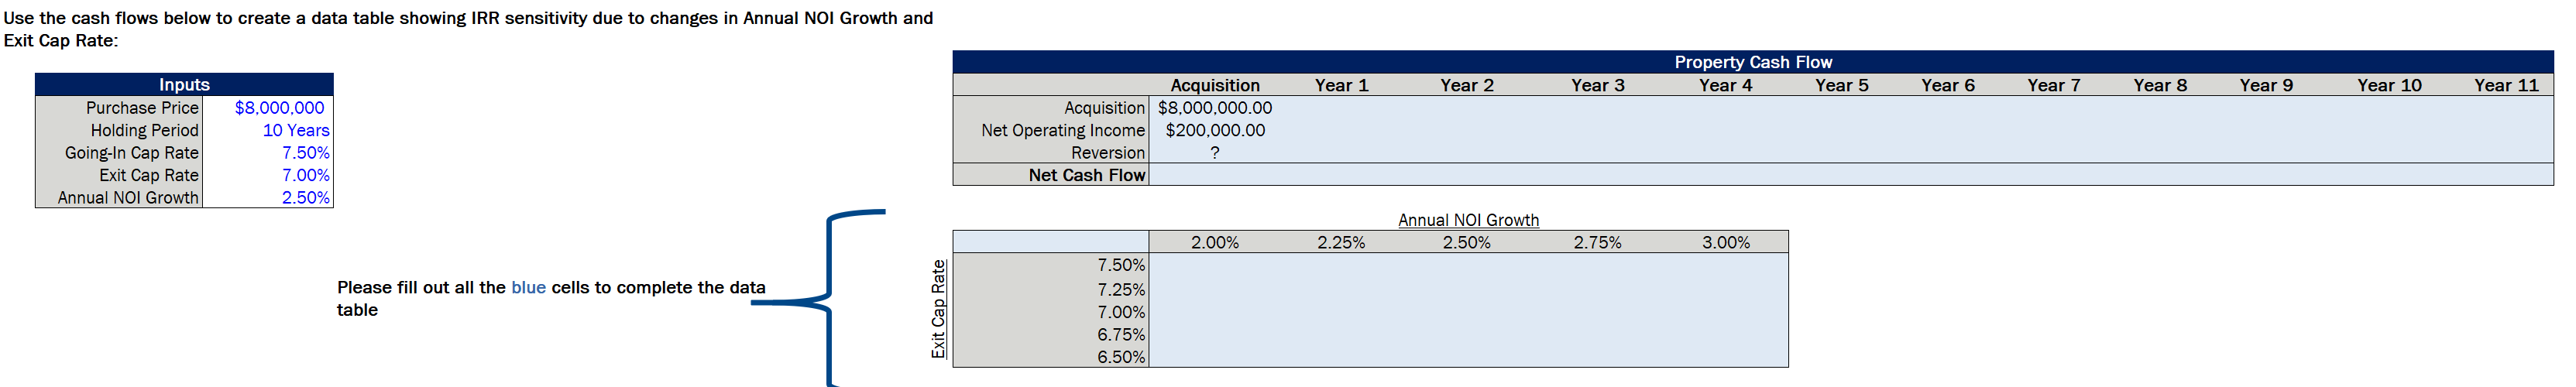
Use the cash flows below to create a data table showing IRR sensitivity due to changes in Annual NOI Growth and Exit Cap Rate: Property Cash Flow Year 4 Year 5 Year 1 Year 2 Year 3 Year 6 Year 7 Year 8 Year 9 Year 10 Year 11 Inputs Purchase Price Holding Period Going-In Cap Rate Exit Cap Rate Annual NOI Growth $8,000,000 10 Years 7.50% 7.00% 2.50% Acquisition Acquisition $8,000,000.00 Net Operating Income $200,000.00 Reversion ? Net Cash Flow Annual NOI Growth 2.50% 2.00% 2.25% 2.75% 3.00% Please fill out all the blue cells to complete the data table Exit Cap Rate 7.50% 7.25% 7.00% 6.75% 6.50%
Step by Step Solution
There are 3 Steps involved in it

Get step-by-step solutions from verified subject matter experts