

Question: Excel - Which graph would be most effective to show the top performing Agent in terms of total premium revenue? A column chart based on
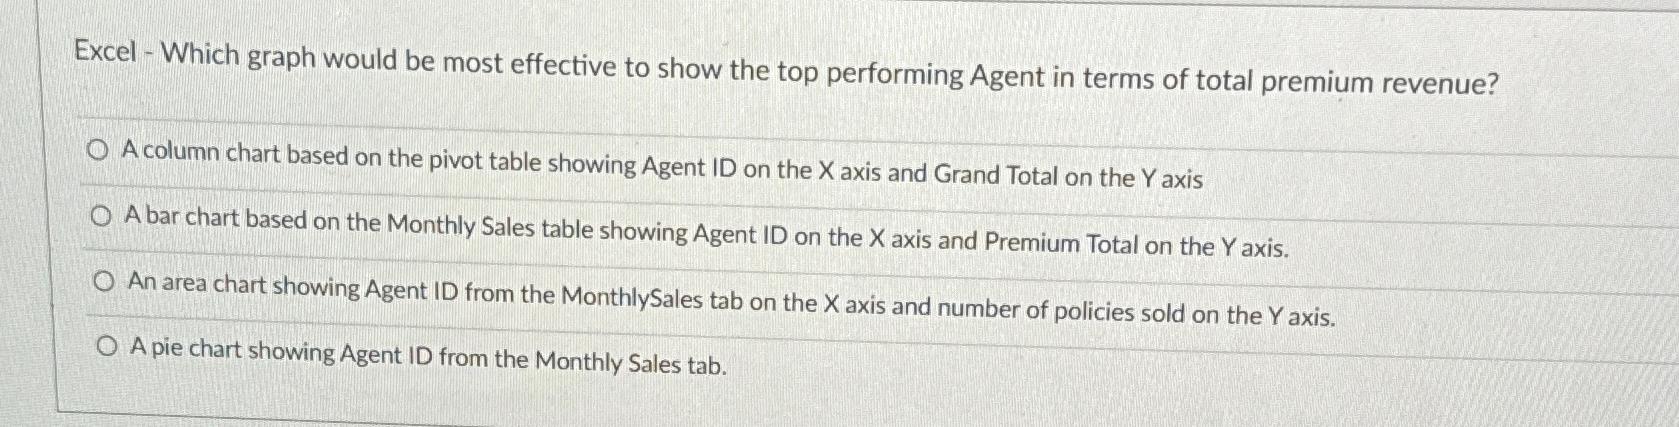
Excel Which graph would be most effective to show the top performing Agent in terms of total premium revenue?
A column chart based on the pivot table showing Agent ID on the axis and Grand Total on the axis
A bar chart based on the Monthly Sales table showing Agent ID on the axis and Premium Total on the axis.
An area chart showing Agent ID from the MonthlySales tab on the axis and number of policies sold on the axis.
A pie chart showing Agent ID from the Monthly Sales tab.
Step by Step Solution
There are 3 Steps involved in it
1 Expert Approved Answer
Step: 1 Unlock

Question Has Been Solved by an Expert!
Get step-by-step solutions from verified subject matter experts
Step: 2 Unlock
Step: 3 Unlock