

Question: Exercise ( 1 ) Ratio Analysis The Vanguard Group, Inc. has compiled the following financial statements and comparative financial ratios for the year - end
Exercise Ratio Analysis
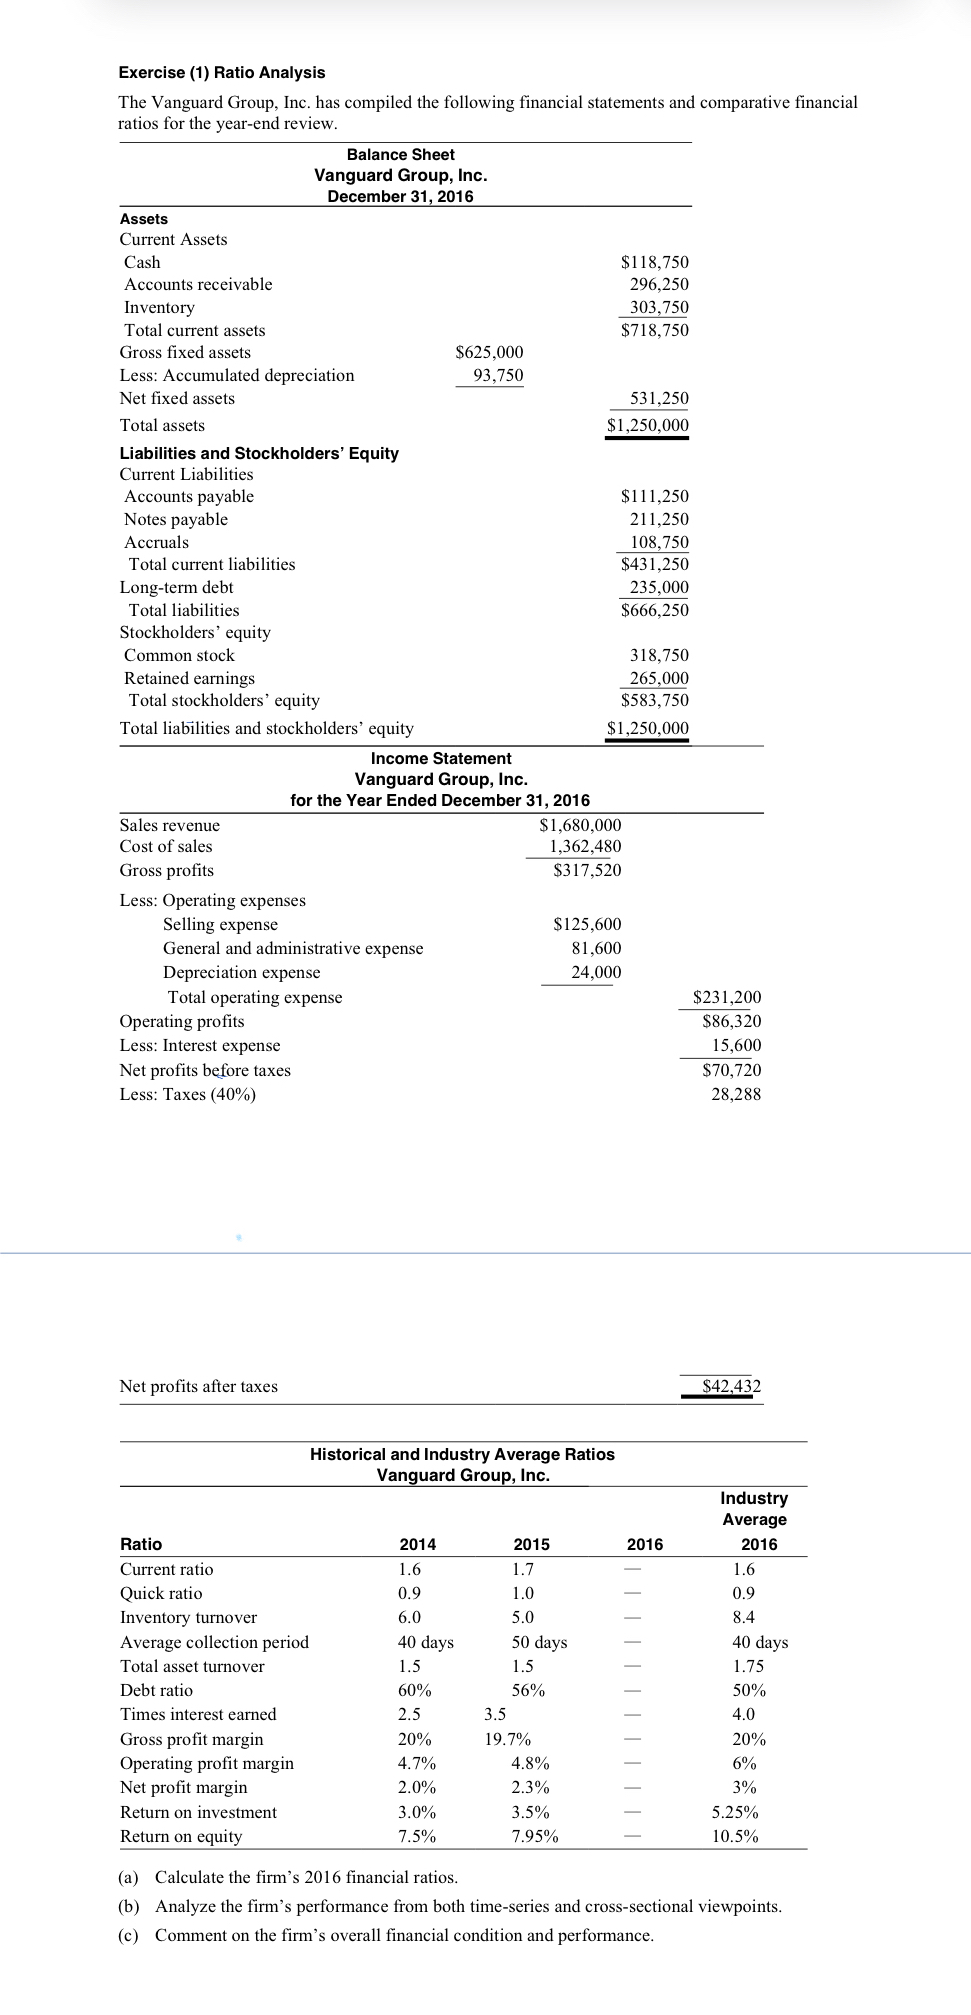
The Vanguard Group, Inc. has compiled the following financial statements and comparative financial ratios for the yearend review.
Net profits after taxes
$
Historical and Industry Average Ratios Vanguard Group, Inc.
tabletableIndustryAverageRatioCurrent ratio,Quick ratio,Inventory turnover,Average collection period, days, days, daysTotal asset turnover,Debt ratio,
Step by Step Solution
There are 3 Steps involved in it
1 Expert Approved Answer
Step: 1 Unlock

Question Has Been Solved by an Expert!
Get step-by-step solutions from verified subject matter experts
Step: 2 Unlock
Step: 3 Unlock