

Question: Financial Statement Analysis Problem - 10 Points: The Vanguard Group, Inc. has compiled the following financial statements and comparative financial ratios for the year-end review.
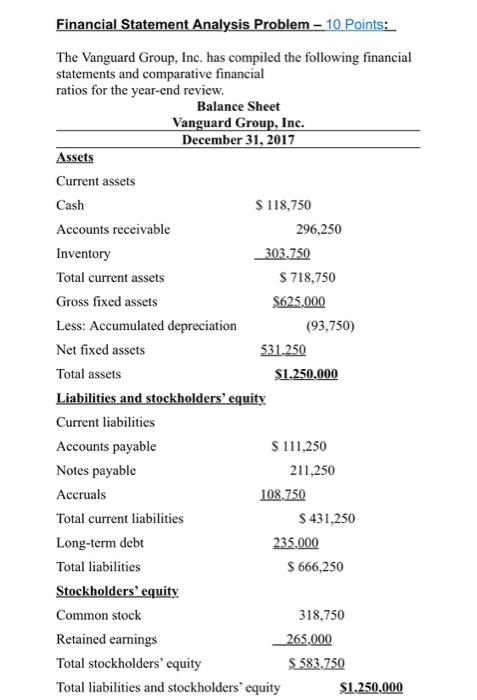
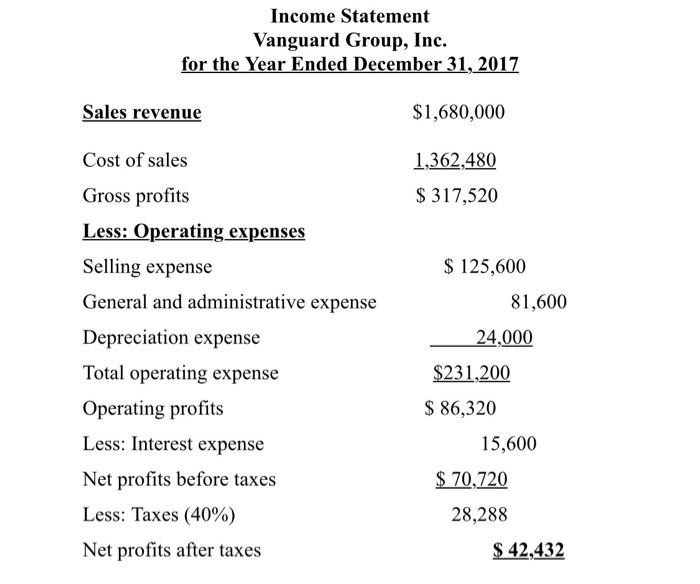
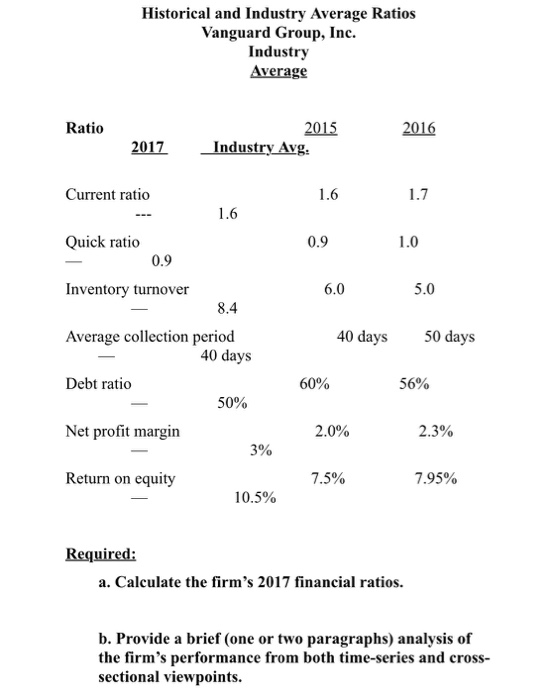
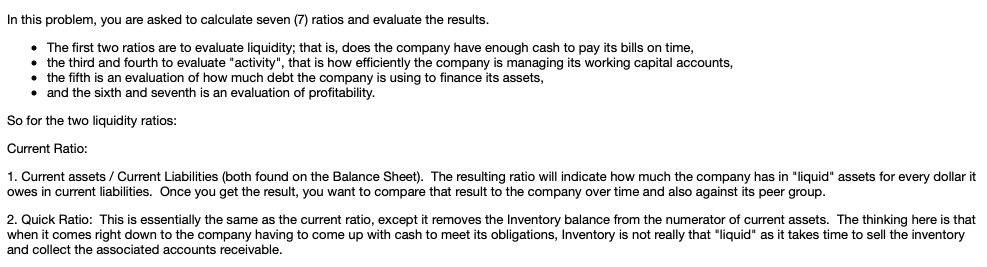
Financial Statement Analysis Problem - 10 Points: The Vanguard Group, Inc. has compiled the following financial statements and comparative financial ratios for the year-end review. Balance Sheet Vanguard Group, Inc. December 31, 2017 Assets Current assets Cash $ 118,750 Accounts receivable 296,250 Inventory _303.750 Total current assets S 718,750 Gross fixed assets $625.000 Less: Accumulated depreciation (93,750) Net fixed assets 531.250 Total assets $1.250.000 Liabilities and stockholders' equity Current liabilities Accounts payable S 111,250 Notes payable 211,250 Accruals 108.750 Total current liabilities S 431,250 Long-term debt 235.000 Total liabilities $ 666,250 Stockholders' equity Common stock 318.750 Retained earnings 265.000 Total stockholders' equity S583.750 Total liabilities and stockholders' equity $1,250,000 Income Statement Vanguard Group, Inc. for the Year Ended December 31, 2017 Sales revenue $1,680,000 1,362,480 $ 317,520 Cost of sales Gross profits Less: Operating expenses Selling expense General and administrative expense Depreciation expense Total operating expense Operating profits Less: Interest expense Net profits before taxes Less: Taxes (40%) Net profits after taxes $ 125,600 81,600 24,000 $231,200 $ 86,320 15,600 $ 70,720 28,288 $ 42,432 Historical and Industry Average Ratios Vanguard Group, Inc. Industry Average Ratio 2015 Industry Avg. 2017 Current ratio 1.6 0.9 Quick ratio o Inventory turnover 0.9 6.0 1.0 5.0 8.4 40 days 50 days 60% Average collection period 40 days Debt ratio 50% Net profit margin 3% 56% 2.0% 2.3% Return on equity 7.5% 7.95% 10.5% Required: a. Calculate the firm's 2017 financial ratios. b. Provide a brief (one or two paragraphs) analysis of the firm's performance from both time-series and cross- sectional viewpoints. In this problem, you are asked to calculate seven (7) ratios and evaluate the results. The first two ratios are to evaluate liquidity; that is, does the company have enough cash to pay its bills on time, the third and fourth to evaluate "activity", that is how efficiently the company is managing its working capital accounts, the fifth is an evaluation of how much debt the company is using to finance its assets, and the sixth and seventh is an evaluation of profitability. So for the two liquidity ratios: Current Ratio: 1. Current assets / Current Liabilities (both found on the Balance Sheet). The resulting ratio will indicate how much the company has in "liquid" assets for every dollar it owes in current liabilities. Once you get the result, you want to compare that result to the company over time and also against its peer group. 2. Quick Ratio: This is essentially the same as the current ratio, except it removes the Inventory balance from the numerator of current assets. The thinking here is that when it comes right down to the company having to come up with cash to meet its obligations, Inventory is not really that "liquid" as it takes time to sell the inventory and collect the associated accounts receivable
Step by Step Solution
There are 3 Steps involved in it

Get step-by-step solutions from verified subject matter experts