

Question: EXERCISE 1.2 WORKING WITH INCOME DATA LINK You can see the interactive graph and download the spreadsheet data that we used to create Figure 1.2.
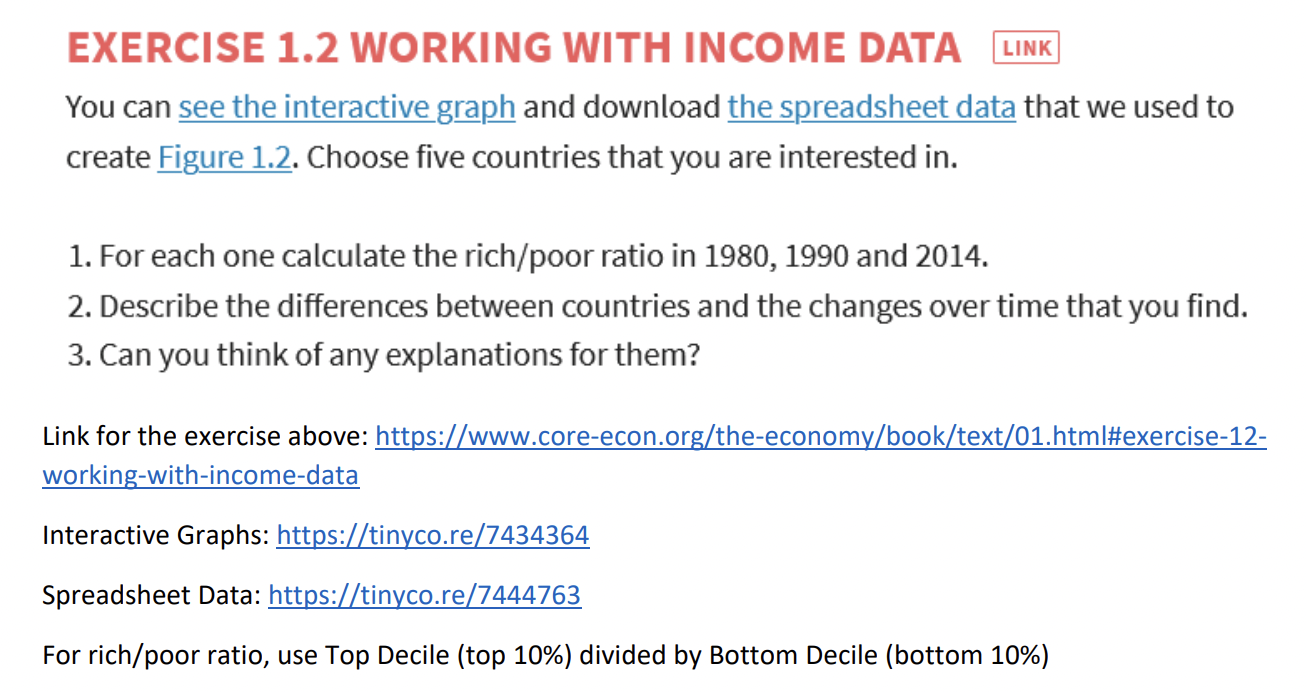

EXERCISE 1.2 WORKING WITH INCOME DATA LINK You can see the interactive graph and download the spreadsheet data that we used to create Figure 1.2. Choose five countries that you are interested in. 1. For each one calculate the rich/poor ratio in 1980, 1990 and 2014. 2. Describe the differences between countries and the changes over time that you find. 3. Can you think of any explanations for them? Link for the exercise above: https://www.core-econ.org/the-economy/book/text/01.html#exercise-12- working-with-income-data Interactive Graphs: https://tinyco.re/7434364 Spreadsheet Data: https://tinyco.re/7444763 For rich/poor ratio, use Top Decile (top 10%) divided by Bottom Decile (bottom 10%)
Step by Step Solution
There are 3 Steps involved in it

Get step-by-step solutions from verified subject matter experts