

Question: Exercise 130 Comparative financial statement data for Arthur Corporation and Lancelot Corporation, two competitors, appear below. All balance sheet data are as of December 31,
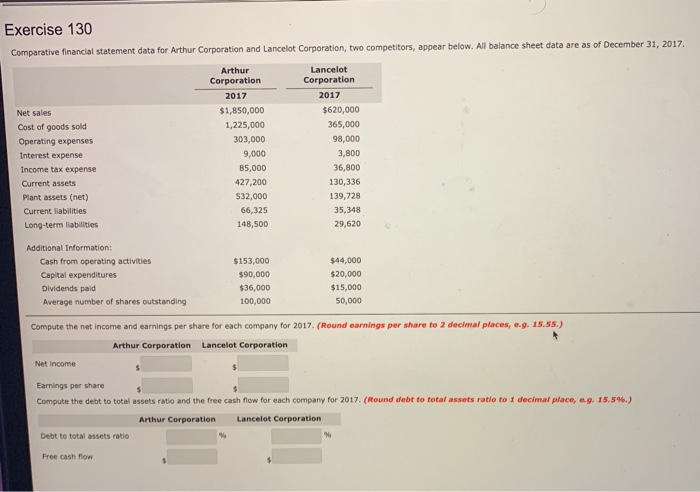
Exercise 130 Comparative financial statement data for Arthur Corporation and Lancelot Corporation, two competitors, appear below. All balance sheet data are as of December 31, 2017. Lancelot Arthur Corporation Corporation 2017 2017 $1,850,000 $620,000 Net sales 1,225,000 365,000 Cost of goods sold 98,000 303,000 Operating expenses 9,000 3,800 Interest expense 85,000 36,800 Income tax expense 130,336 427,200 Current assets 532,000 139,728 Plant assets (net) Current liabilities 66,325 35,348 Long-term liabilities 148,500 29,620 Additional Information: $44,000 Cash from operating activities $153,000 $90,000 $20,000 Capital expenditures $15,000 Dividends paid $36,000 50,000 100,000 Average number of shares outstanding Compute the net income and earnings per share for each company for 2017. (Round earnings per share to 2 decimal places, e.g. 15.55.) Arthur Corporation Lancelot Corporation Net income Earnings per share Compute the debt to total assets ratio and the free cash flow for each company for 2017. (Round debt to total assets ratio to 1 decimal place, e.g. 15.5% .) Lancelot Corporation Arthur Corporation Debt to total assets ratio % Free cash flow
Step by Step Solution
There are 3 Steps involved in it

Get step-by-step solutions from verified subject matter experts