

Question: Question 3 (20 minutes) Comparative financial statement data for Arthur Corporation and Lancelot Corporation, two competitors, appear below. All balance sheet data are as of
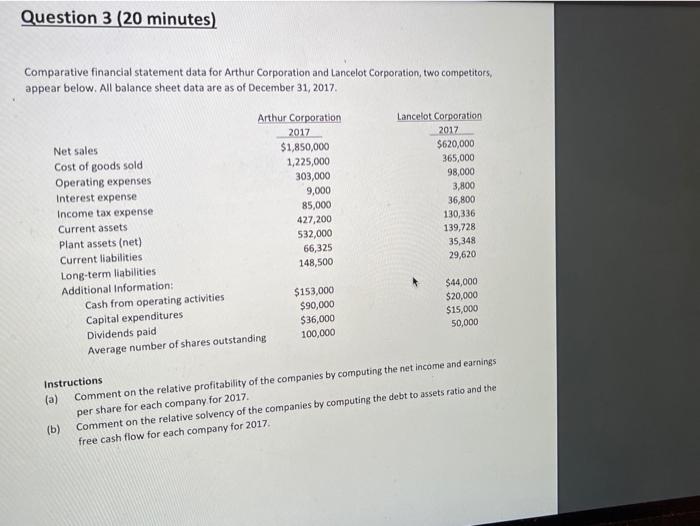
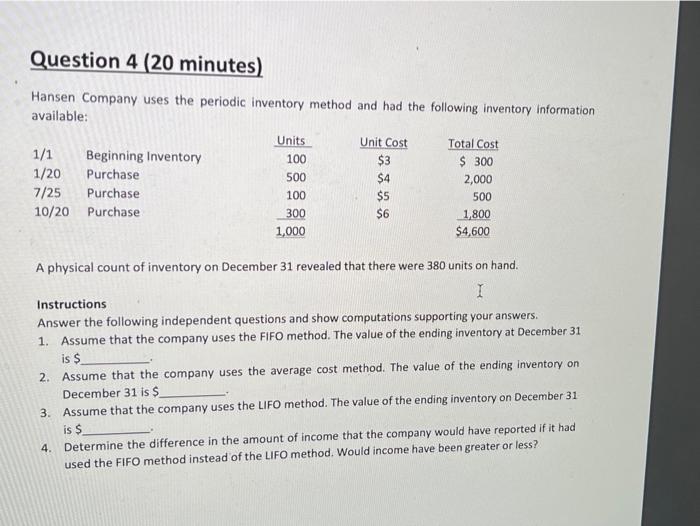
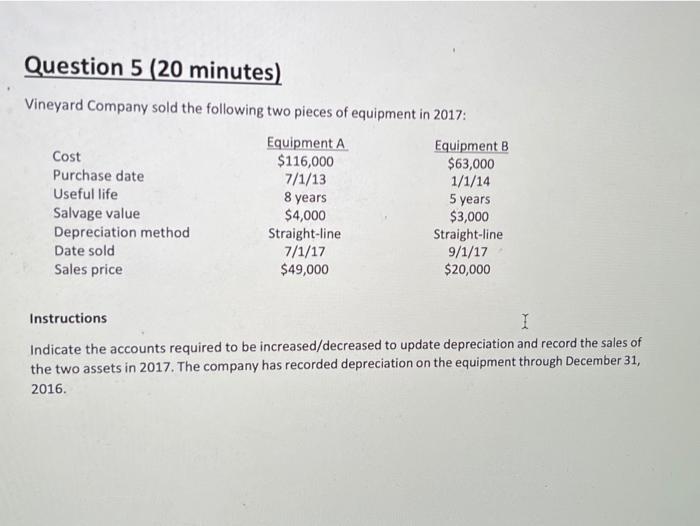
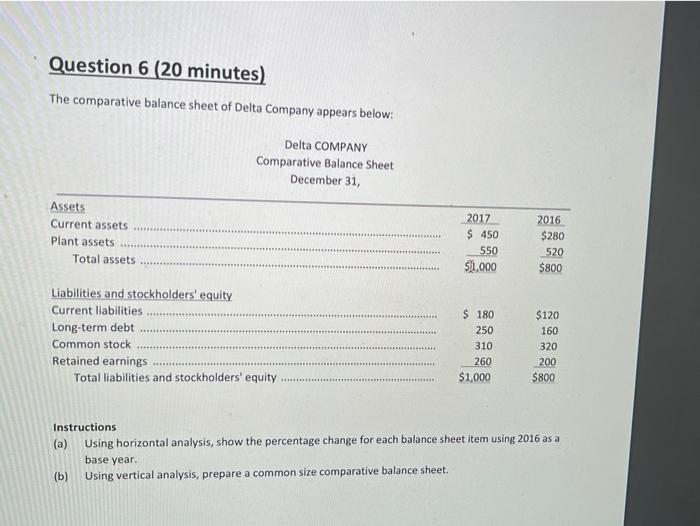
Question 3 (20 minutes) Comparative financial statement data for Arthur Corporation and Lancelot Corporation, two competitors, appear below. All balance sheet data are as of December 31, 2017 Arthur Corporation Lancelot Corporation 2017 2017 Net sales $1,850,000 $620,000 Cost of goods sold 1,225,000 365,000 Operating expenses 303,000 98,000 Interest expense 9,000 3,800 Income tax expense 85,000 36,800 Current assets 427,200 130,336 Plant assets (net) 532,000 139,728 35,348 66,325 Current liabilities 29,620 148,500 Long-term liabilities Additional Information: $153,000 $44,000 Cash from operating activities $90,000 $20,000 Capital expenditures $36,000 $15,000 Dividends paid 50,000 Average number of shares outstanding 100,000 Instructions (a) Comment on the relative profitability of the companies by computing the net income and earnings per share for each company for 2017, (b) Comment on the relative solvency of the companies by computing the debt to assets ratio and the free cash flow for each company for 2017. Question 4 (20 minutes) Hansen Company uses the periodic inventory method and had the following inventory Information available: Units Unit Cost Total Cost 1/1 Beginning Inventory $3 $ 300 1/20 Purchase 500 $4 2,000 7/25 Purchase $5 500 10/20 Purchase $6 1,800 1,000 $4,600 100 100 300 A physical count of inventory on December 31 revealed that there were 380 units on hand. Instructions Answer the following independent questions and show computations supporting your answers. 1. Assume that the company uses the FIFO method. The value of the ending inventory at December 31 is $ 2. Assume that the company uses the average cost method. The value of the ending inventory on December 31 is $ 3 Assume that the company uses the LIFO method. The value of the ending inventory on December 31 is $ 4. Determine the difference in the amount of income that the company would have reported if it had used the FIFO method instead of the LIFO method. Would income have been greater or less? Question 5 (20 minutes) Vineyard Company sold the following two pieces of equipment in 2017: Equipment A Equipment B Cost $116,000 $63,000 Purchase date 7/1/13 1/1/14 Useful life 8 years 5 years Salvage value $4,000 $3,000 Depreciation method Straight-line Straight-line Date sold 7/1/17 9/1/17 Sales price $49,000 $20,000 Instructions I Indicate the accounts required to be increased/decreased to update depreciation and record the sales of the two assets in 2017. The company has recorded depreciation on the equipment through December 31, 2016. Question 6 (20 minutes) The comparative balance sheet of Delta Company appears below: Delta COMPANY Comparative Balance Sheet December 31, Assets Current assets Plant assets Total assets 2017 $ 450 550 $1.000 2016 $280 520 $800 Liabilities and stockholders' equity Current liabilities Long-term debt Common stock Retained earnings Total liabilities and stockholders' equity $ 180 250 310 260 $1,000 $120 160 320 200 $800 Instructions (a) Using horizontal analysis, show the percentage change for each balance sheet item using 2016 as a base year. (b) Using vertical analysis, prepare a common size comparative balance sheet
Step by Step Solution
There are 3 Steps involved in it

Get step-by-step solutions from verified subject matter experts