

Question: Exercise 13-3 Computing and interpreting common-size percents LO P1 Sales Cost of goods sold Accounts receivable 2019 2018 2017 2016 2015 $639,927 $423,793 $339,034 $232,215
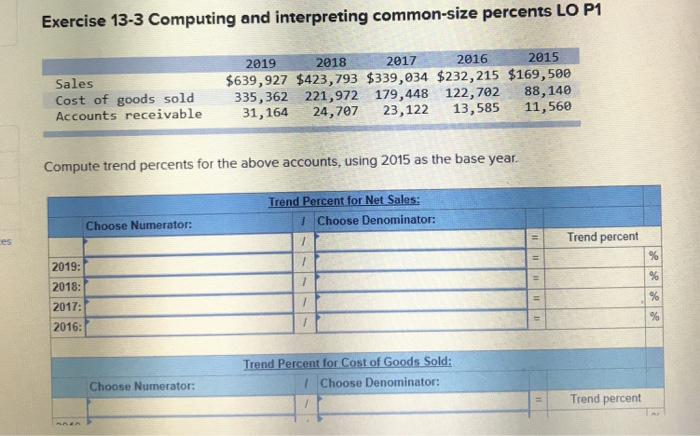
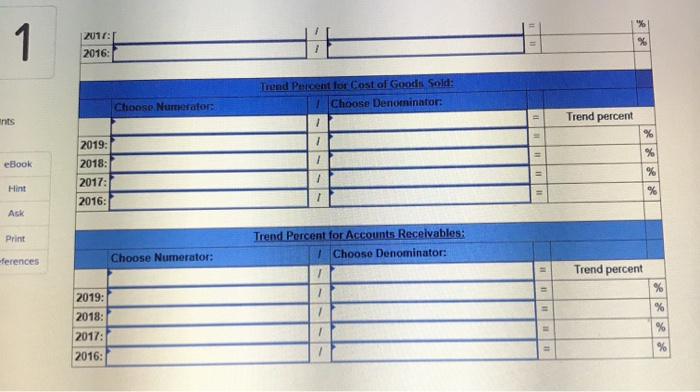
Exercise 13-3 Computing and interpreting common-size percents LO P1 Sales Cost of goods sold Accounts receivable 2019 2018 2017 2016 2015 $639,927 $423,793 $339,034 $232,215 $169,500 335, 362 221,972 179,448 122,702 88,140 31,164 24,707 23,122 13,585 11,560 Compute trend percents for the above accounts, using 2015 as the base year. Trend Percent for Net Sales: 1 Choose Denominator: Choose Numerator: Trend percent 2019: 2018: 2017: 2016: Trend Percent for Cost of Goods Sold: 1 Choose Denominator: Choose Numerator: Trend percent 2017: 2016: Trend Percent for Cost of Goods Sold: Choose Denominator: Choose Numerator: Trend percent 2019: eBook 2018: Hint 2017: 2016: Ask Print Trend Percent for Accounts Receivables: 1 Choose Denominator: ferences Choose Numerator: Trend percent 2019: 2018: 2017: 2016
Step by Step Solution
There are 3 Steps involved in it

Get step-by-step solutions from verified subject matter experts