

Question: Exercise 16-9 Static (Using Excel) Use Excel's Analysis ToolPak, with a seed of 1, to generate 500 random observations based on the following frequency
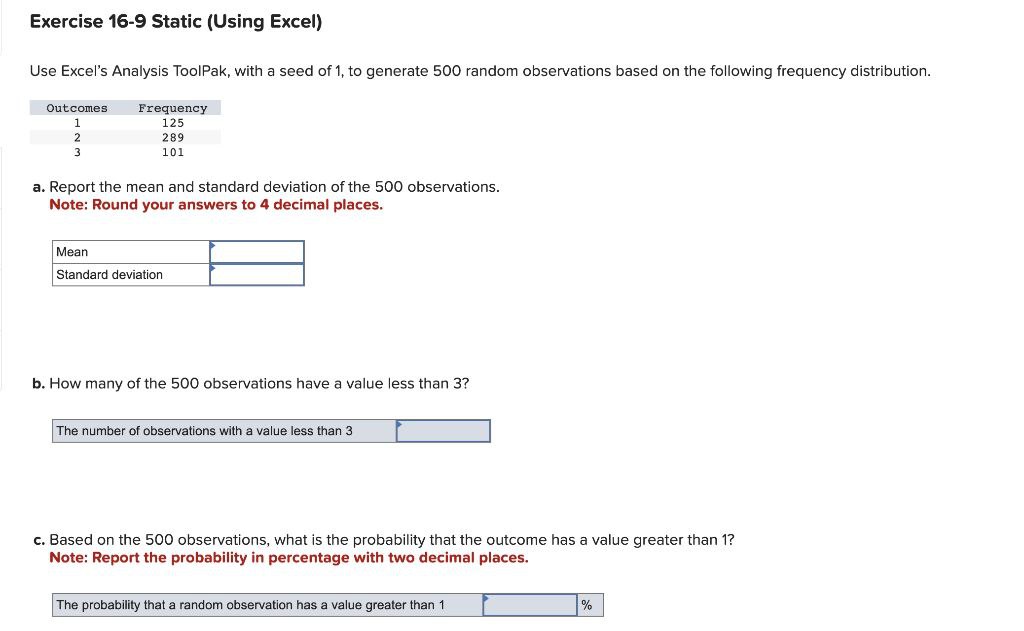
Exercise 16-9 Static (Using Excel) Use Excel's Analysis ToolPak, with a seed of 1, to generate 500 random observations based on the following frequency distribution. Outcomes Frequency 125 1 2 289 3 101 a. Report the mean and standard deviation of the 500 observations. Note: Round your answers to 4 decimal places. Mean Standard deviation b. How many of the 500 observations have a value less than 3? The number of observations with a value less than 3 c. Based on the 500 observations, what is the probability that the outcome has a value greater than 1? Note: Report the probability in percentage with two decimal places. The probability that a random observation has a value greater than 1 %
Step by Step Solution
There are 3 Steps involved in it

Get step-by-step solutions from verified subject matter experts