

Question: Exercise 2 Below are stem-and-leaf plots of n = 40 Statistics Exam 1 scores. One plot uses an increment of 10 and the other uses
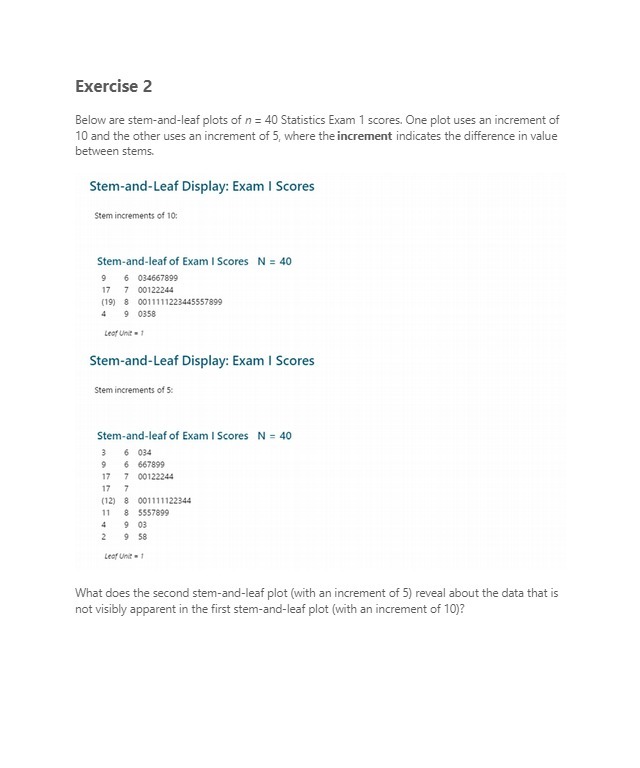
Exercise 2 Below are stem-and-leaf plots of n = 40 Statistics Exam 1 scores. One plot uses an increment of 10 and the other uses an increment of 5, where the increment indicates the difference in value between stems. Stem-and-Leaf Display: Exam I Scores Stem increments of 10: Stem-and-leaf of Exam I Scores N = 40 9 6 034667899 17 7 00122244 (19) 8 0011111223445557899 4 9 0358 Leaf Unit . 1 Stem-and-Leaf Display: Exam I Scores Stem increments of 5: Stem-and-leaf of Exam I Scores N = 40 6 034 6 667899 17 7 00122244 001111122344 11 8 5557895 58 What does the second stem-and-leaf plot (with an increment of 5) reveal about the data that is not visibly apparent in the first stem-and-leaf plot (with an increment of 10)
Step by Step Solution
There are 3 Steps involved in it

Get step-by-step solutions from verified subject matter experts