

Question: Exercise 2 The monthly average of minimum and maximum temperature in Celsius is given in the table below. Write a program to display graphically using
Exercise 2
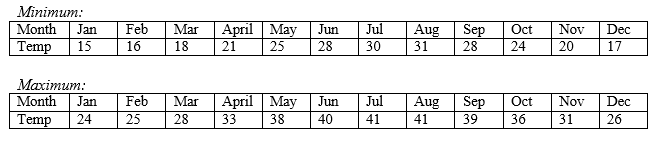
The monthly average of minimum and maximum temperature in Celsius is given in the table below.
Write a program to display graphically using column chart the average minimum and maximum temperature against each month in a year using the Graphic2D class.
Sample Output: Must match the output given below
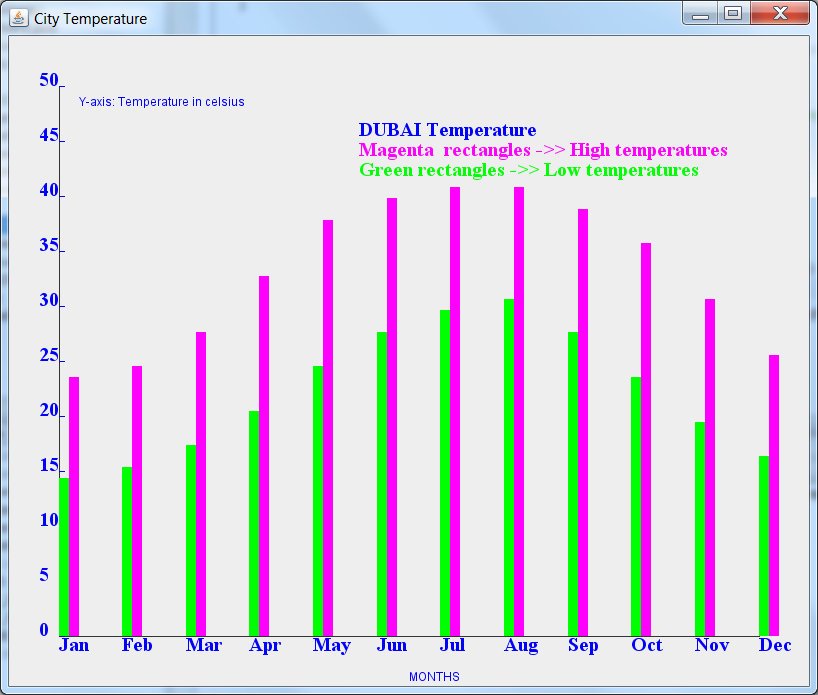
Note: Make sure that the graphs also resize relative to the window when the window is resized. Provide screen shots to justify resizing of graphs.
Minimum Month Jan Feb Tem Jun 28 Oct Nov Dec 24 15 16 18 21 25 30 31 28 20 17 aximiim Month Jan Feb 24 May Jun J 38 AugSep Oct NovDec 36 Tem 25 28 40 39 31 26
Step by Step Solution
There are 3 Steps involved in it
1 Expert Approved Answer
Step: 1 Unlock

Question Has Been Solved by an Expert!
Get step-by-step solutions from verified subject matter experts
Step: 2 Unlock
Step: 3 Unlock