

Question: Any help on this question would be appreciated. Project: Instruction: You have been hired by the city to visualize some simple weather data. The data
Any help on this question would be appreciated.
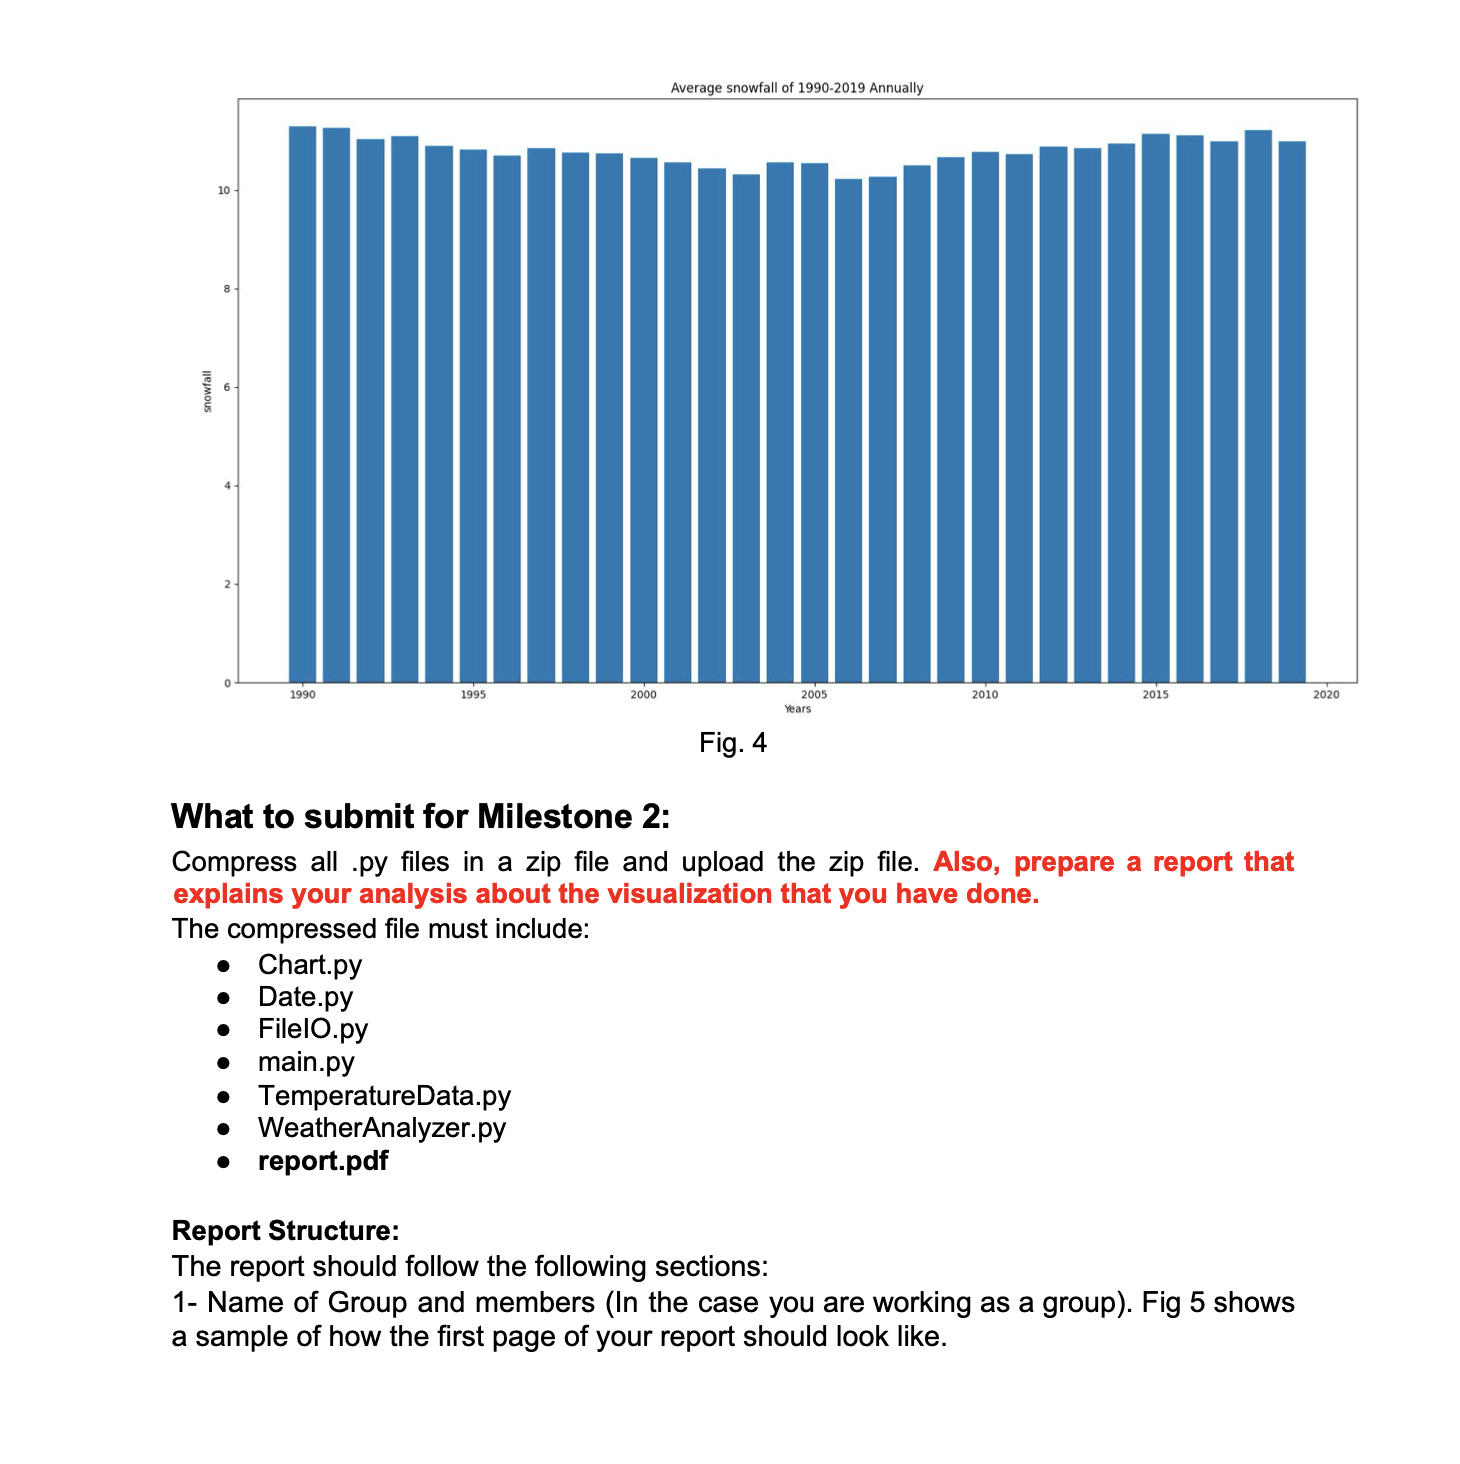
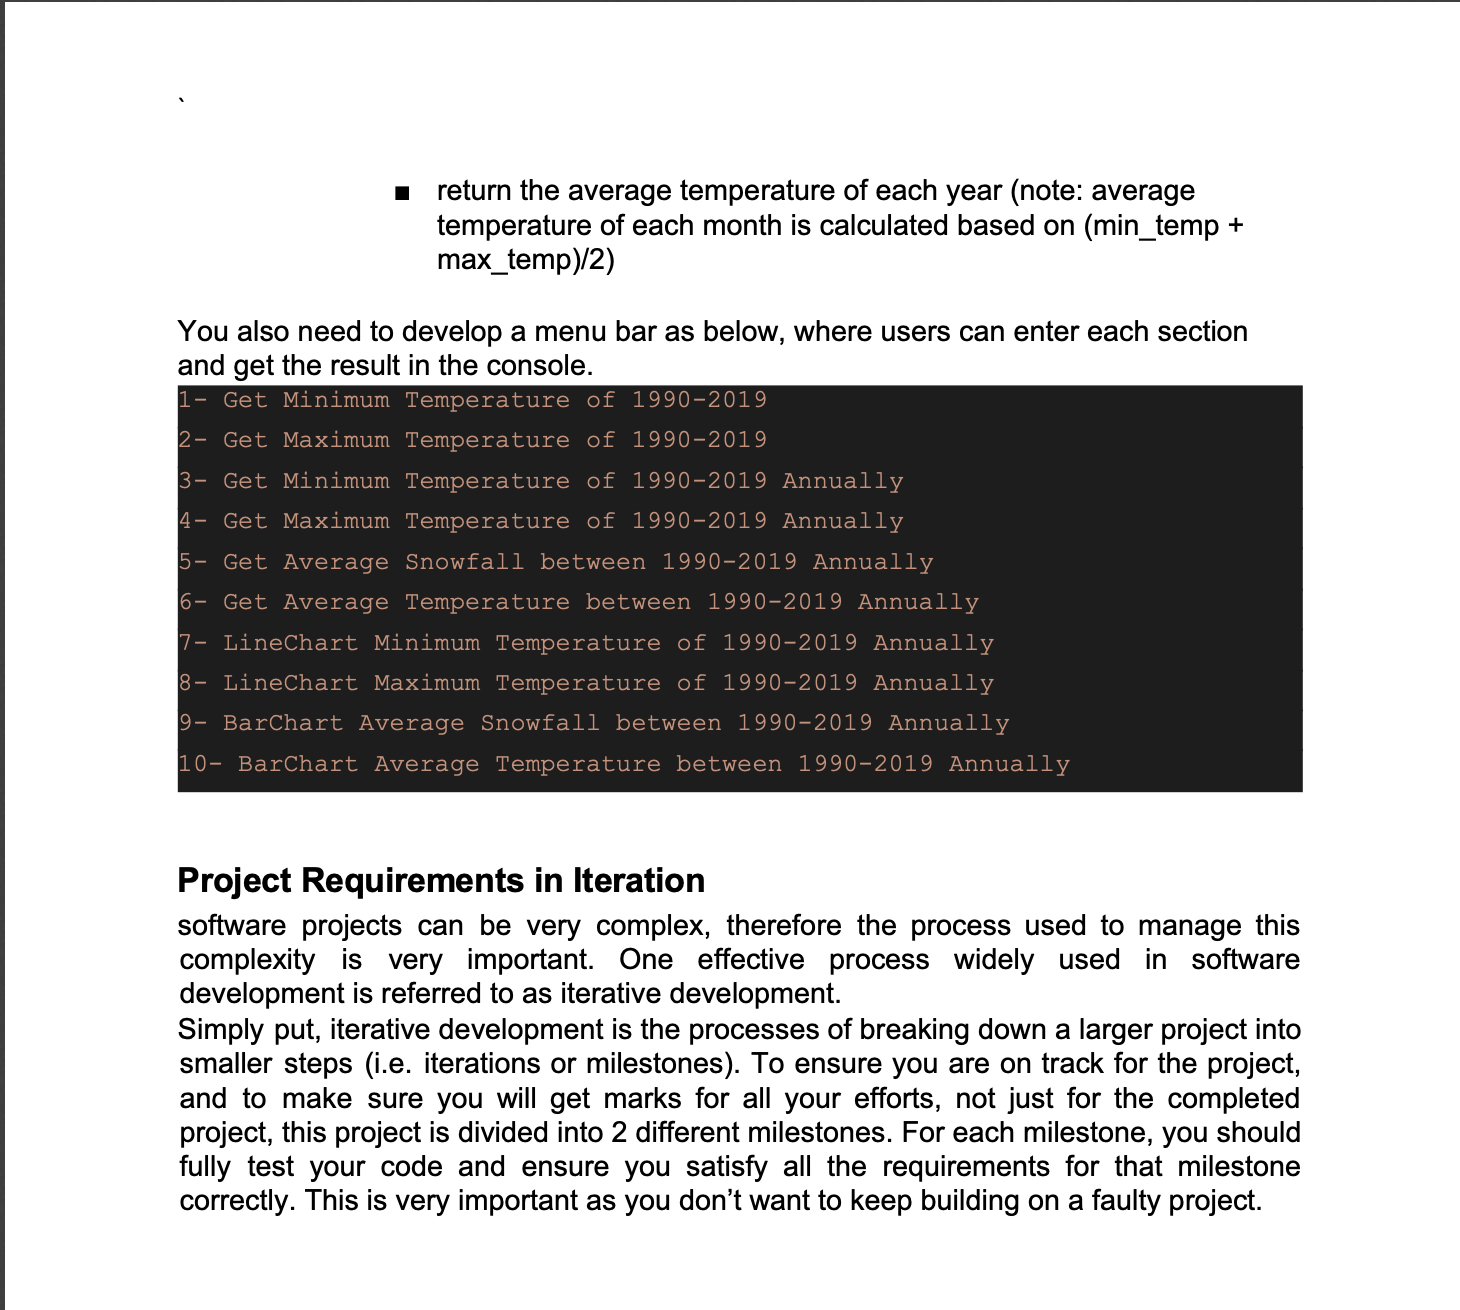
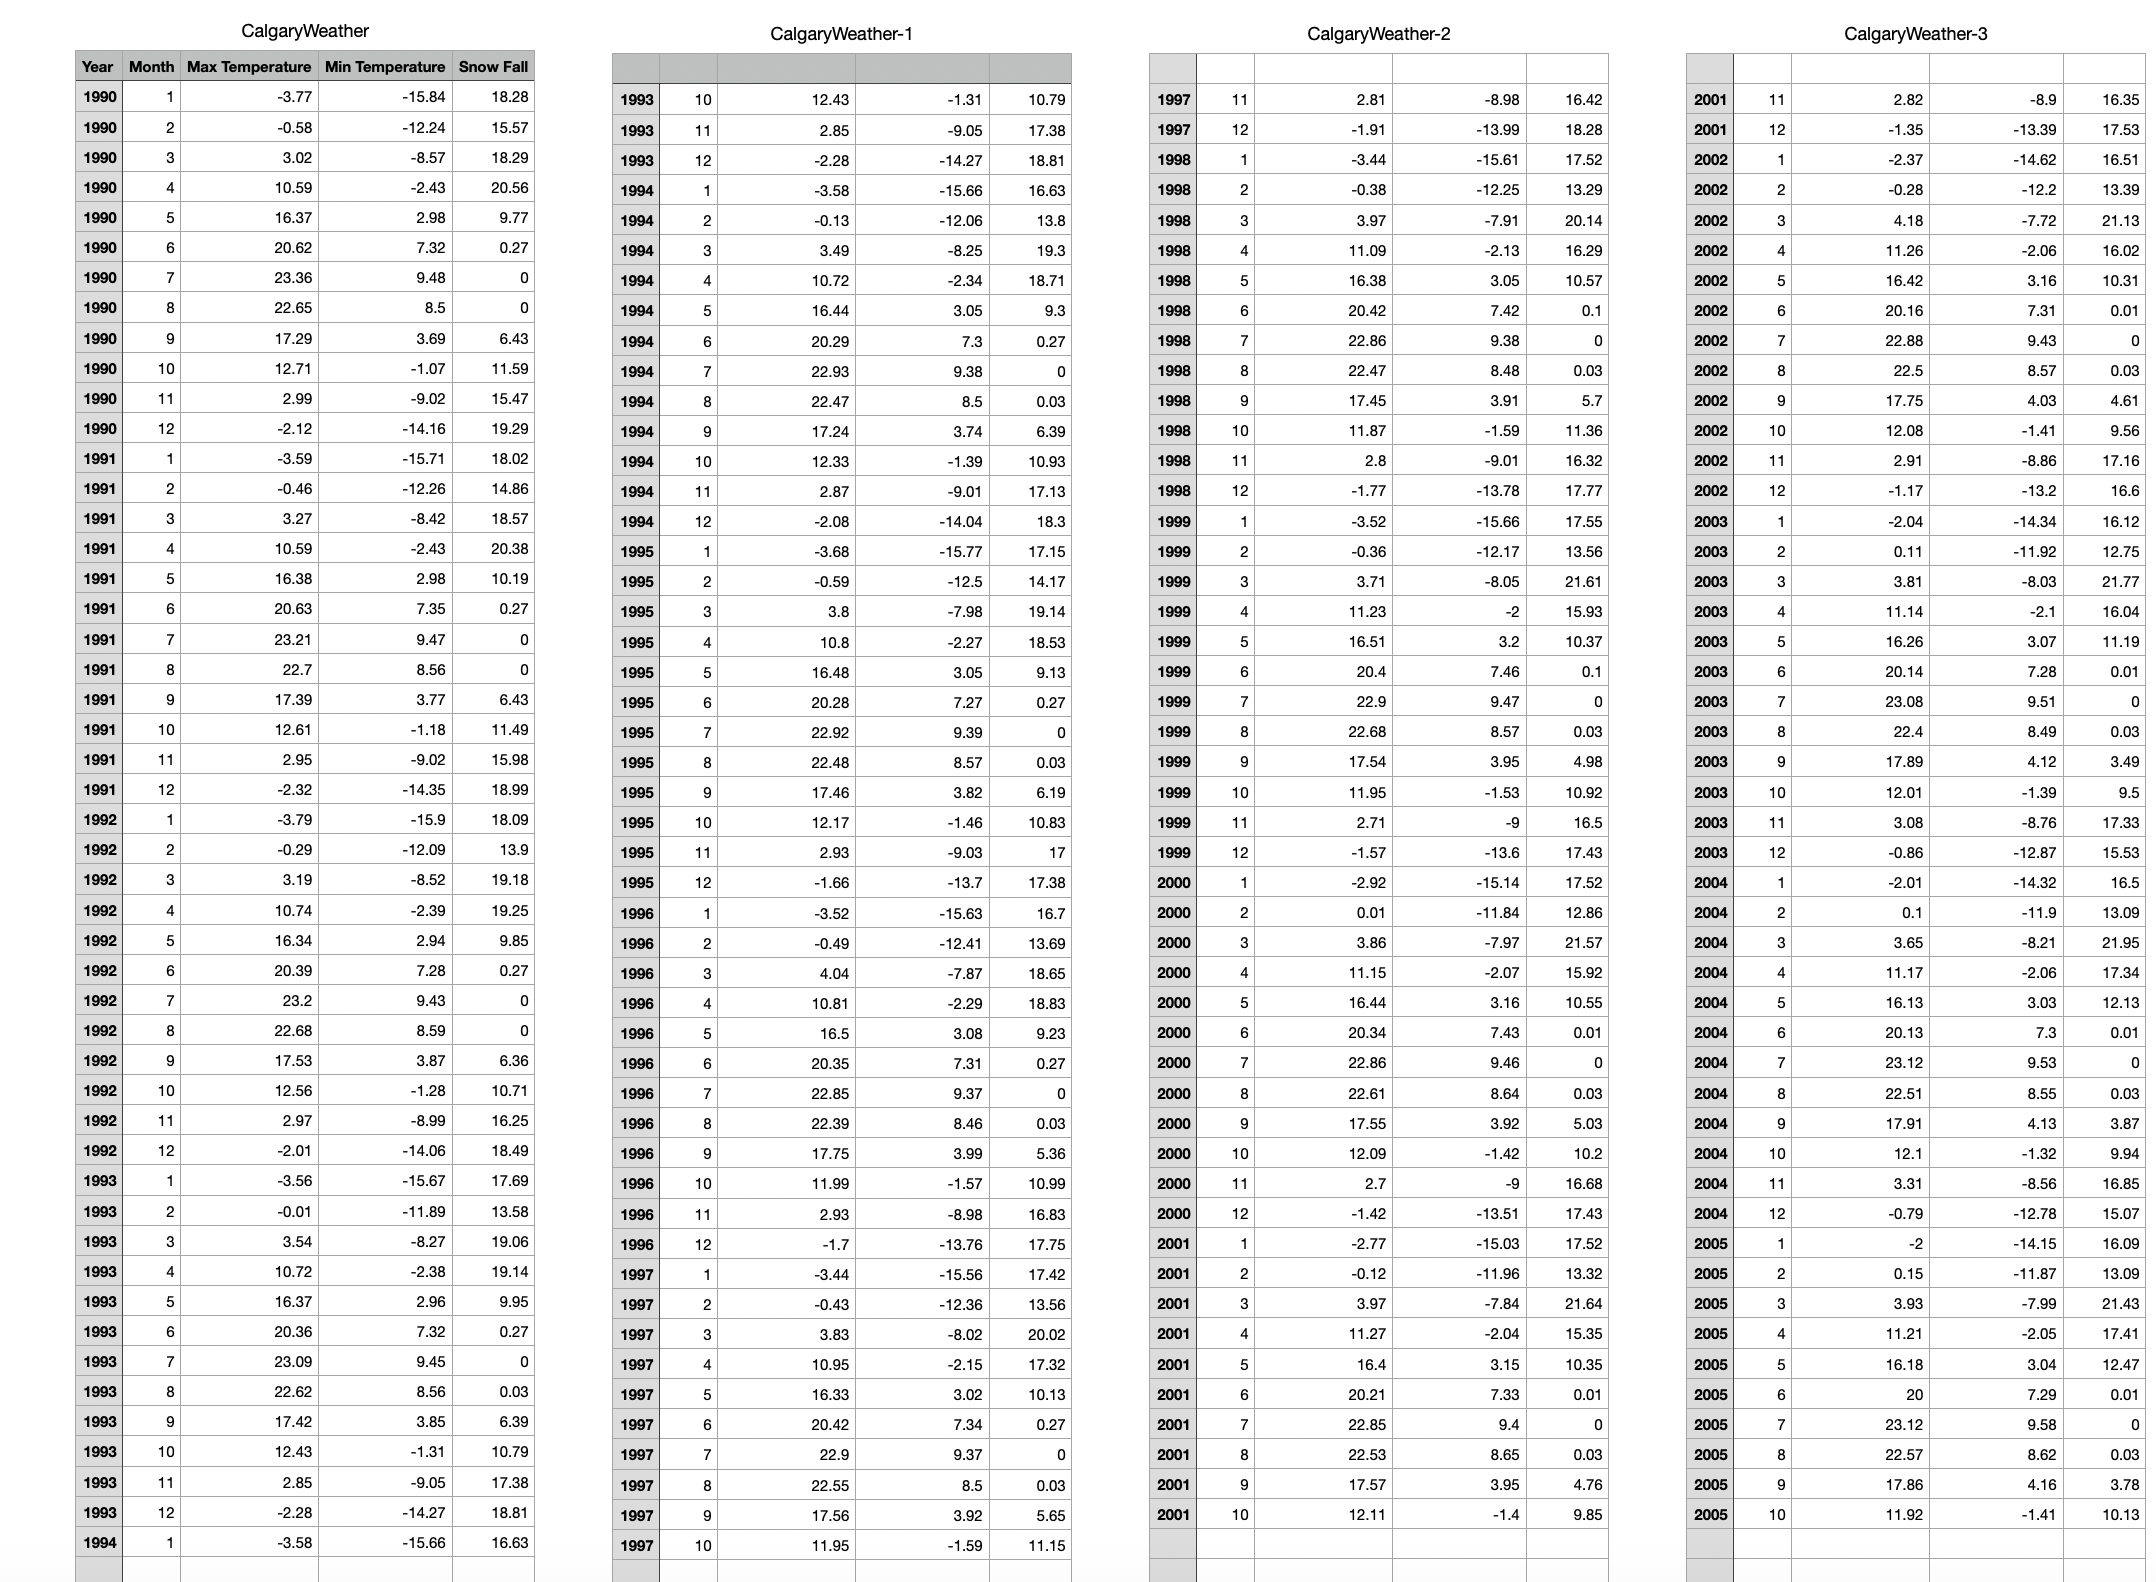
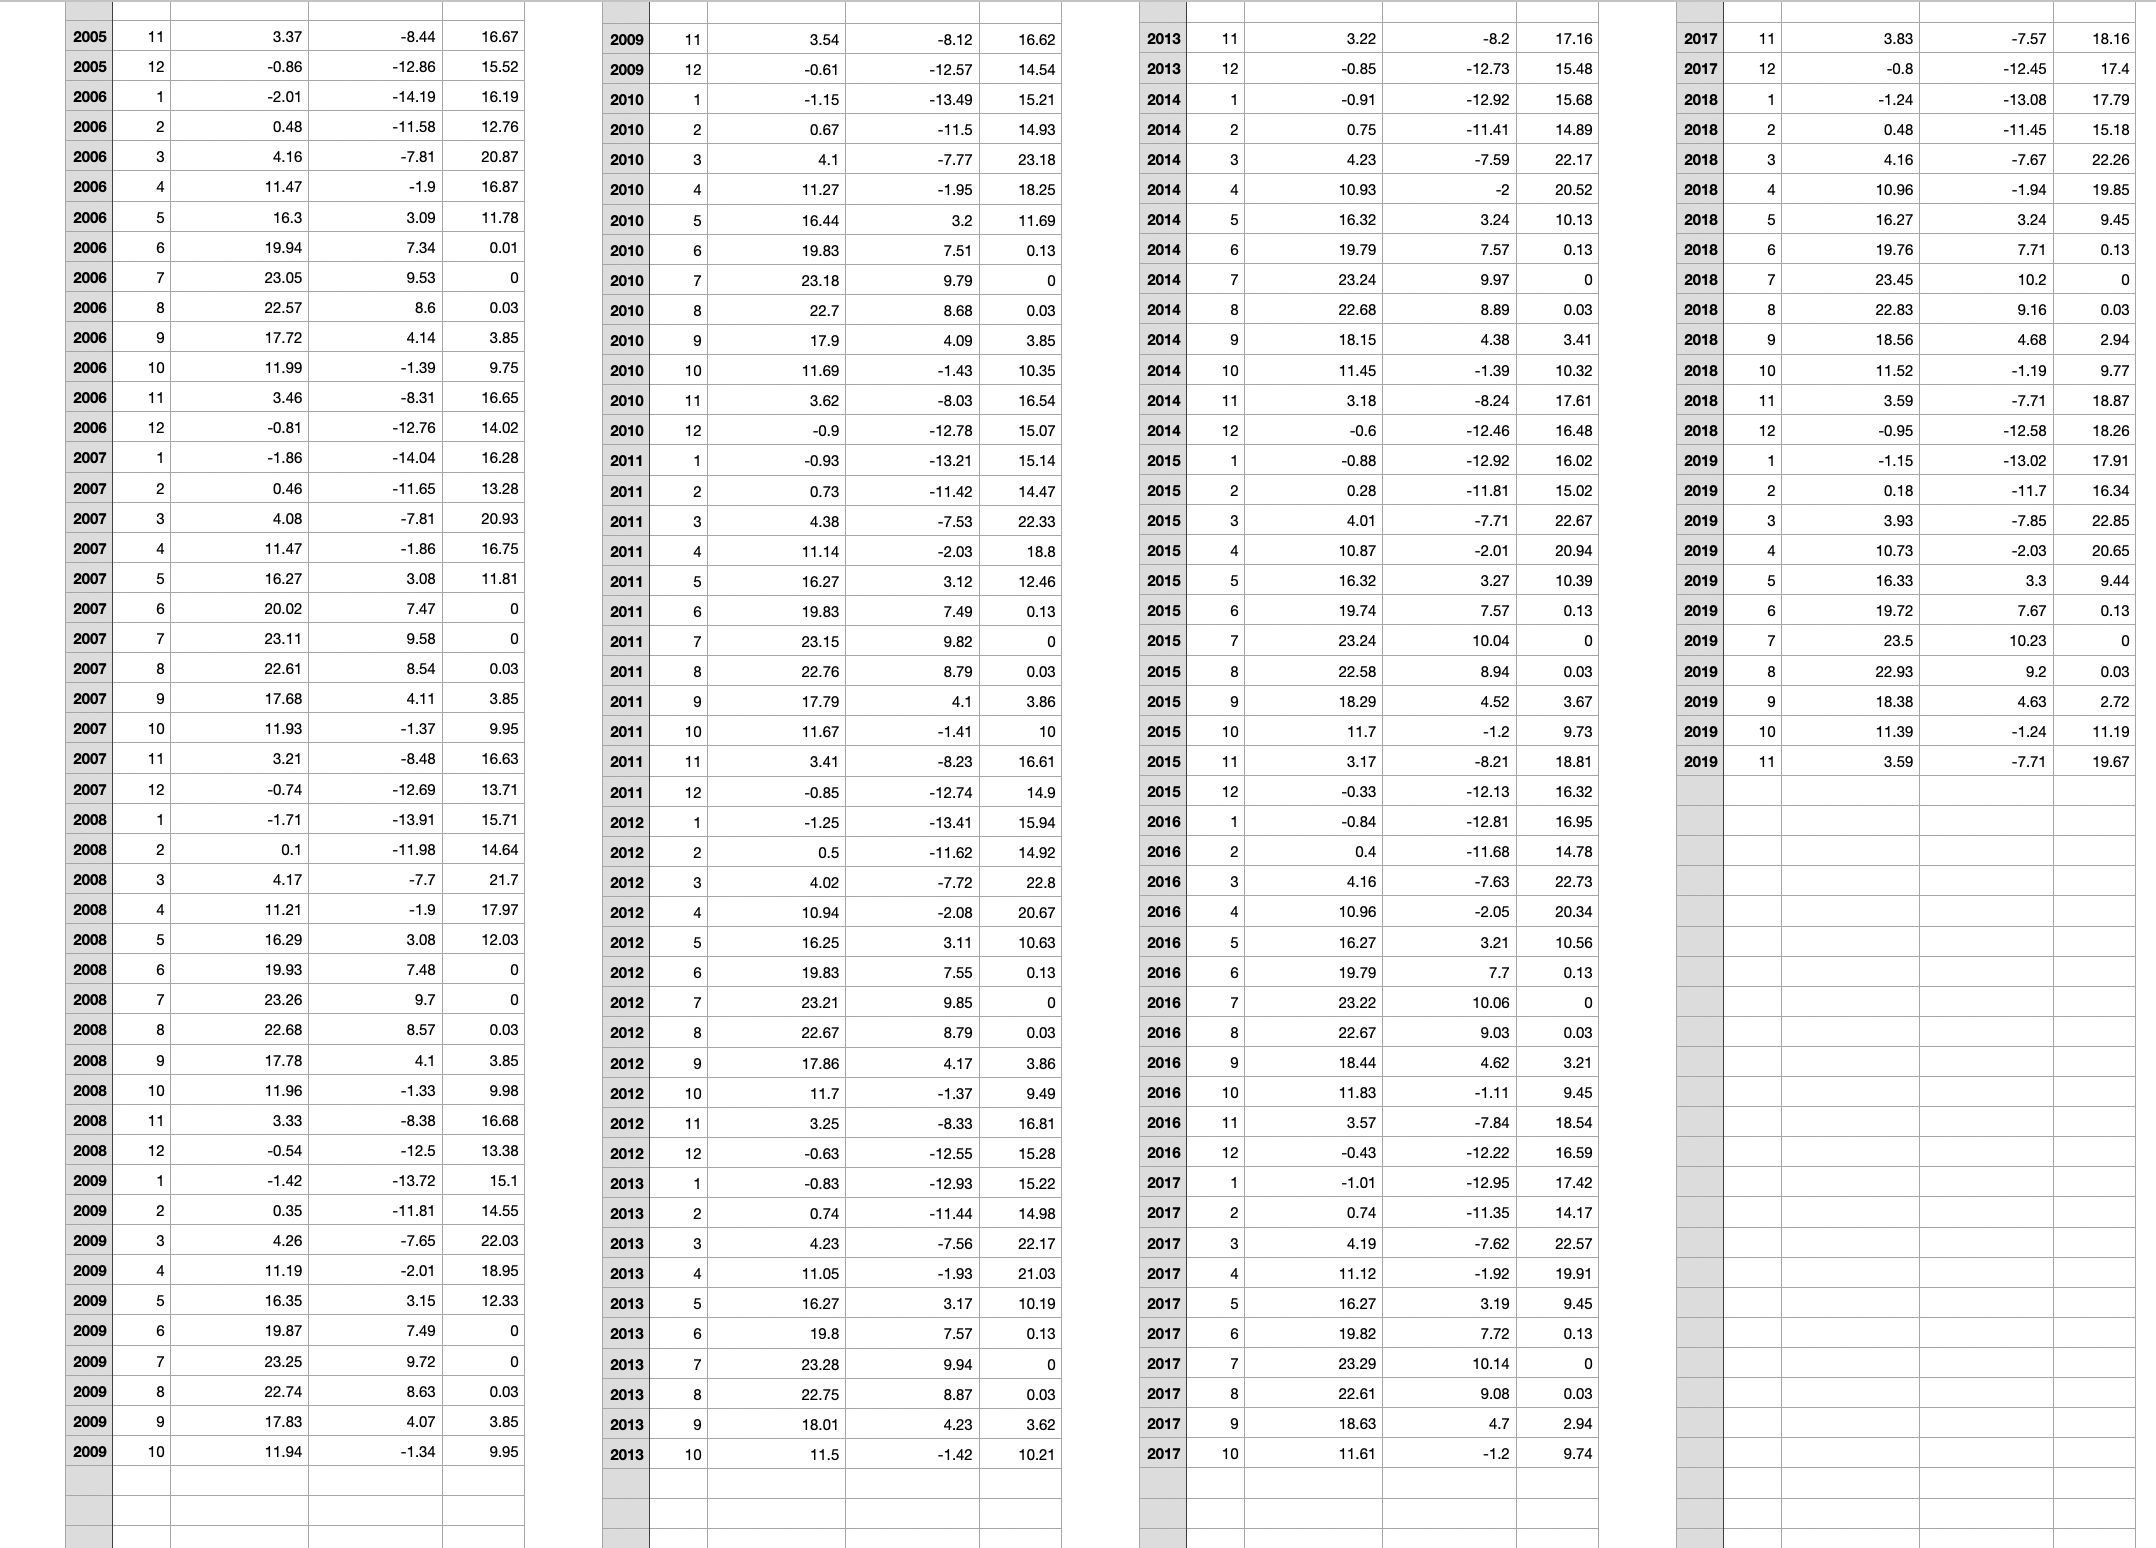
Project: Instruction: You have been hired by the city to visualize some simple weather data. The data provides the average daily minimum and maximum temperature for each month for about 30 years. Your job is to analyze this data and visualize some important features from the given data. The project is divided into two milestone o Back-end development (Object Oriented Programming) 0 Data Analysis (feature extraction and data visualization) You need to visualize the data using the following charts: 0 Bar chart (Guide: https://pjhonspot.com/matplotlib-barchart/ ) 0 Line chart (Guide: Fig.2) The Data: The data used for this project has been downloaded from the following source: https://calga[y.weatherstats.ca/charts/precipitation-monthly.html and has been simplied for your project. Please download the \".csv\" le called CalgaryWeather.csv from D2L to use for this project. The minimum requirements of the project are divided into visualization and data analysis: Requirements (Checklist) o milestone 1: [35 Marks) 0 Get the minimum temperature of 1990-2019 Get the maximum temperature of 1990-2019 Get the minimum temperature of 1990-2019 annually Get the maximum temperature of 1990-2019 annually Get the average snowfall between 1990-2019 annually | 0000 Program Modules and Classes: Your program must have several classes that will be organized as separate files. Here is the list of some of the modules or classes that your program should have with the minimum requirements below - note that you will need to add member functions and possibly extra member variables to the classes listed below - : . Class Filelo The class has the following member variables filePath to store the path of the selected sensor data file o dataTable of type numpy to load the data in the csv input file Class Date Member variables : o Month Year . Class TemperatureData Member variables : A Date object o min Temperature maxTemperature o snowFall . Class Chart These classes handle the plotting of each type of graph. They would have member functions such as o drawLineChart(x,y, title,xlabel,ylabel) o drawBarChart(x,y, title,xlabel,ylabel) Class WeatherAnalyzer Member variables : o list of temperatureData objects The methods inside weatherAnalyzer: o getMin Temp return the minimum temperature of the given data o getMin TempAnnually return the minimum temperature of the given data according to each year o getMaxTemp return the maximum temperature of the given data o getMaxTempAnnually return the maximum temperature of the given data according to each year getAvgSnowFallAnnually return a 2D list of each year average snowfall getAvg TempAnnuallyMilestonez: In this milestone you are expected to implement the rest of the project including: If a user chooses option 7, 8, 9, or 10, the program should visualize the results. For example, For option 7 and 8 the results should be presented in a line chart. For example, if the user selects option 7, the output would be like Fig. 4. Average snowfall of 1990-2019 Annually 10 snowfall 0661 1995 2000 2005 2015 ears 2010 2020 Fig. 4 What to submit for Milestone 2: Compress all .py files in a zip file and upload the zip file. Also, prepare a report that explains your analysis about the visualization that you have done. The compressed file must include: Chart.py Date.py . . FileIO.py main.py TemperatureData.py WeatherAnalyzer.py report.pdf Report Structure: The report should follow the following sections: 1- Name of Group and members (In the case you are working as a group). Fig 5 shows a sample of how the first page of your report should look like.return the average temperature of each year (note: average temperature of each month is calculated based on (min_temp + max_temp)/2) You also need to develop a menu bar as below, where users can enter each section and get the result in the console. Get Minimum Temperature of 1990-2019 2 - Get Maximum Temperature of 1990-2019 3- Get Minimum Temperature of 1990-2019 Annually 4- Get Maximum Temperature of 1990-2019 Annually 5- Get Average Snowfall between 1990-2019 Annually 6- Get Average Temperature between 1990-2019 Annually 7- LineChart Minimum Temperature of 1990-2019 Annually 8- LineChart Maximum Temperature of 1990-2019 Annually 9 - BarChart Average Snowfall between 1990-2019 Annually 10- BarChart Average Temperature between 1990-2019 Annually Project Requirements in Iteration software projects can be very complex, therefore the process used to manage this complexity is very important. One effective process widely used in software development is referred to as iterative development. Simply put, iterative development is the processes of breaking down a larger project into smaller steps (i.e. iterations or milestones). To ensure you are on track for the project, and to make sure you will get marks for all your efforts, not just for the completed project, this project is divided into 2 different milestones. For each milestone, you should fully test your code and ensure you satisfy all the requirements for that milestone correctly. This is very important as you don't want to keep building on a faulty project.\f\f
Step by Step Solution
There are 3 Steps involved in it

Get step-by-step solutions from verified subject matter experts