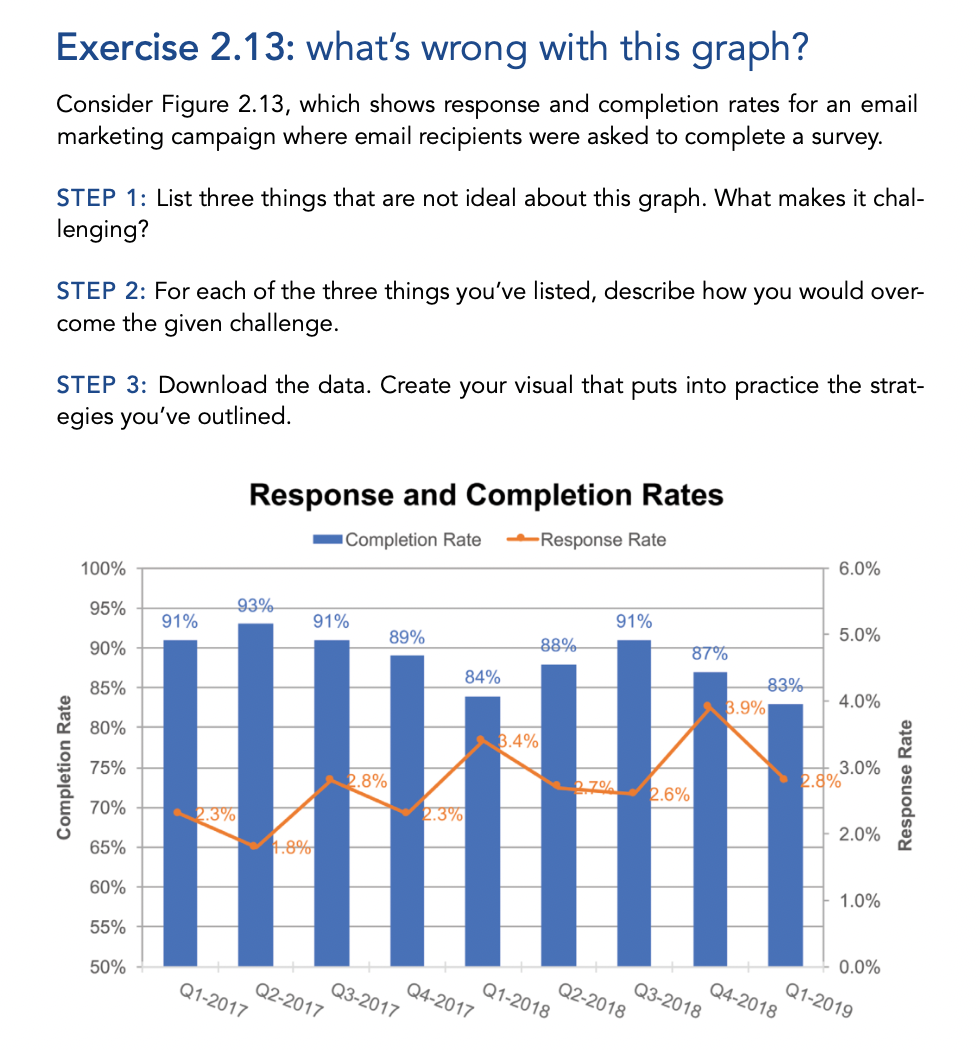
Question: Exercise 2.13: what's wrong with this graph? Consider Figure 2.13, which shows response and completion rates for an email marketing campaign where email recipients were

Exercise 2.13: what's wrong with this graph?

Exercise 2.13: what's wrong with this graph? Consider Figure 2.13, which shows response and completion rates for an email marketing campaign where email recipients were asked to complete a survey. STEP 1: List three things that are not ideal about this graph. What makes it chal- lenging? STEP 2: For each of the three things you've listed, describe how you would over- come the given challenge. STEP 3: Download the data. Create your visual that puts into practice the strat- egies you've outlined. Response and Completion Rates Completion Rate Response Rate 100% 6.0% 95% 93% 91% 91% 91% 89% 5.0% 90% 88% 84% 85% 87% 83% 3.9% 4.0% 80% 3.4% Completion Rate 75% 3.0% 0.8% 0.70 2.9% 2.6% Response Rate 70% 2.3% 2.3% 2.0% 65% 1.8% 60% Q1-2019 Q4-2018 Q3-2018 Q2-2018 Q1-2018 Q4-2017 Q3-2017 Q2-2017 Q1-2017 1.0% 55% 50% 0.0%

Step by Step Solution

There are 3 Steps involved in it

1 Expert Approved Answer
Step: 1 Unlock blur-text-image
Question Has Been Solved by an Expert!

Get step-by-step solutions from verified subject matter experts

Step: 2 Unlock
Step: 3 Unlock

Students Have Also Explored These Related General Management Questions!