

Question: Exercise 2 . 1 3 : what's wrong with this graph? Consider Figure 2 . 1 3 , which shows response and completion rates for
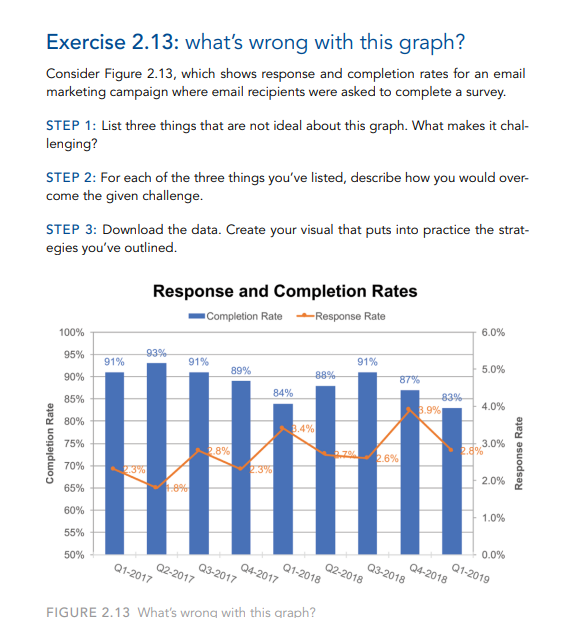
Exercise : what's wrong with this graph?
Consider Figure which shows response and completion rates for an email
marketing campaign where email recipients were asked to complete a survey.
STEP : List three things that are not ideal about this graph. What makes it chal
lenging?
STEP : For each of the three things you've listed, describe how you would over
come the given challenge.
STEP : Download the data. Create your visual that puts into practice the strat
egies you've outlined.
Response and Completion Rates
Step by Step Solution
There are 3 Steps involved in it
1 Expert Approved Answer
Step: 1 Unlock

Question Has Been Solved by an Expert!
Get step-by-step solutions from verified subject matter experts
Step: 2 Unlock
Step: 3 Unlock