

Question: Exercise 3 : Connected component analysis. The figure below displays two images: an RGB image on the left and the corresponding grayscale image on the
Exercise : Connected component analysis.
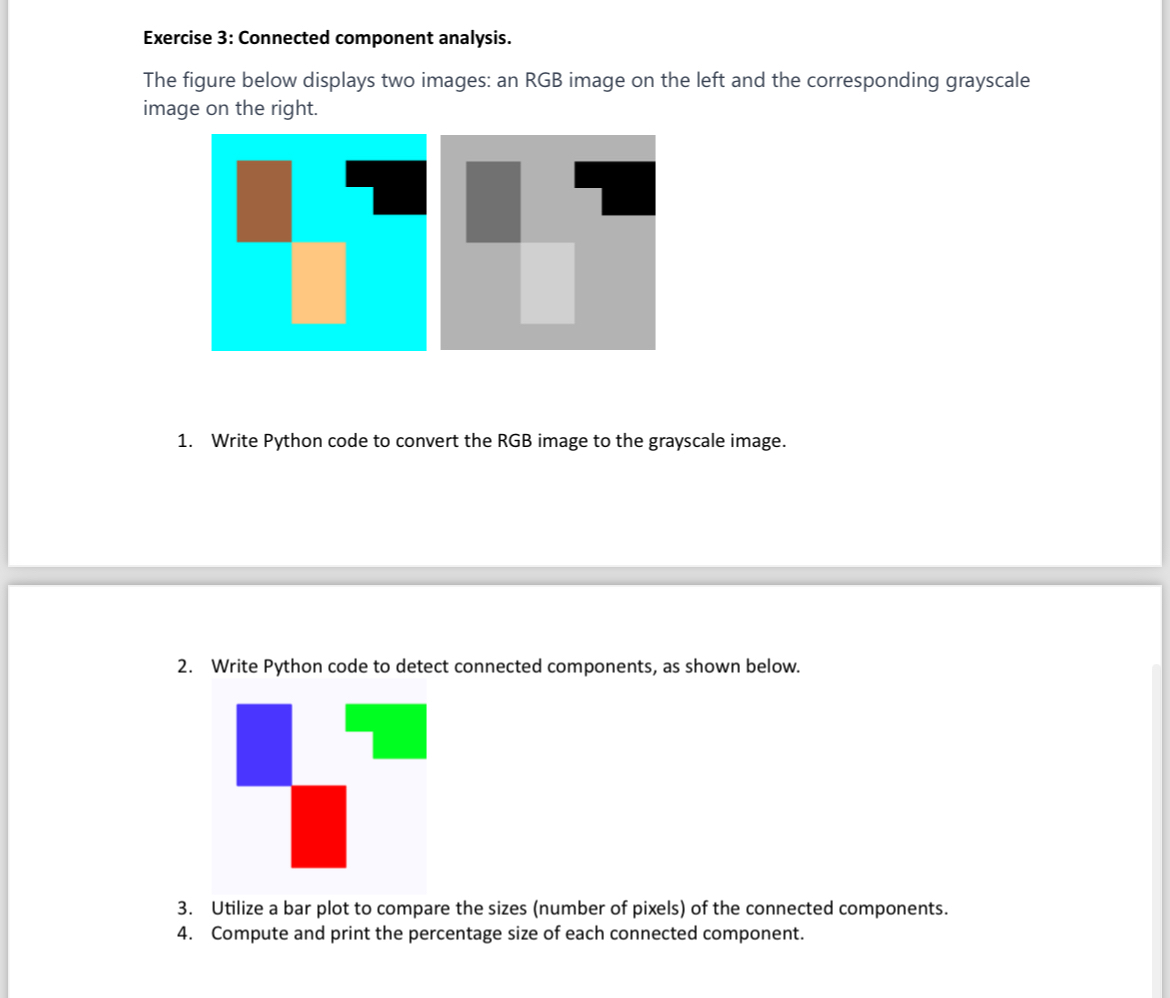
The figure below displays two images: an RGB image on the left and the corresponding grayscale image on the right.
Write Python code to convert the RGB image to the grayscale image.
Write Python code to detect connected components, as shown below.
Utilize a bar plot to compare the sizes number of pixels of the connected components.
Compute and print the percentage size of each connected component.
Step by Step Solution
There are 3 Steps involved in it
1 Expert Approved Answer
Step: 1 Unlock

Question Has Been Solved by an Expert!
Get step-by-step solutions from verified subject matter experts
Step: 2 Unlock
Step: 3 Unlock