

Question: Exercise 3-41 Interpreting Cost Behavior Graphs Examine the graphs in Exercise 3-40. Required: As explained in the chapter, cost behavior patterns can be described as
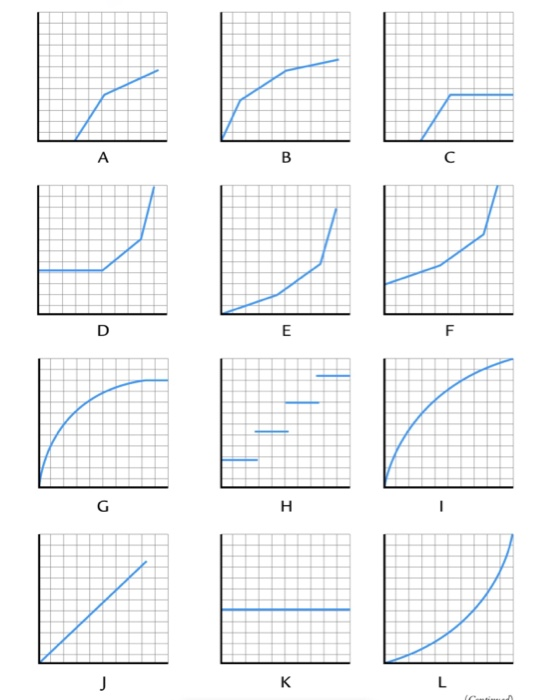
Exercise 3-41 Interpreting Cost Behavior Graphs Examine the graphs in Exercise 3-40. Required: As explained in the chapter, cost behavior patterns can be described as fixed, variable, semi variable, mixed, or step function (i.e., semi-fixed) in nature. Explain the exact type of cost behavior pattern represented by each of the cost curves shown in graphs A through L. Note that some of the graphs might represent a combination of multiple cost behavior patterns
Step by Step Solution
There are 3 Steps involved in it
1 Expert Approved Answer
Step: 1 Unlock

Question Has Been Solved by an Expert!
Get step-by-step solutions from verified subject matter experts
Step: 2 Unlock
Step: 3 Unlock