

Question: Interpreting Cost Behavior Graphs The graphs below represent cost behavior patterns that might occur in a company's cost structure. The vertical axis represents total cost,
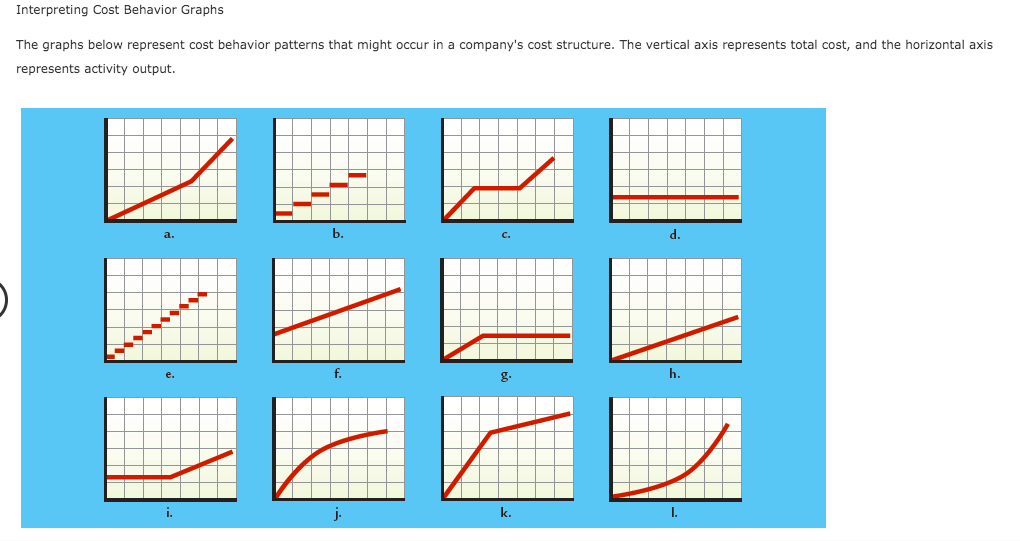
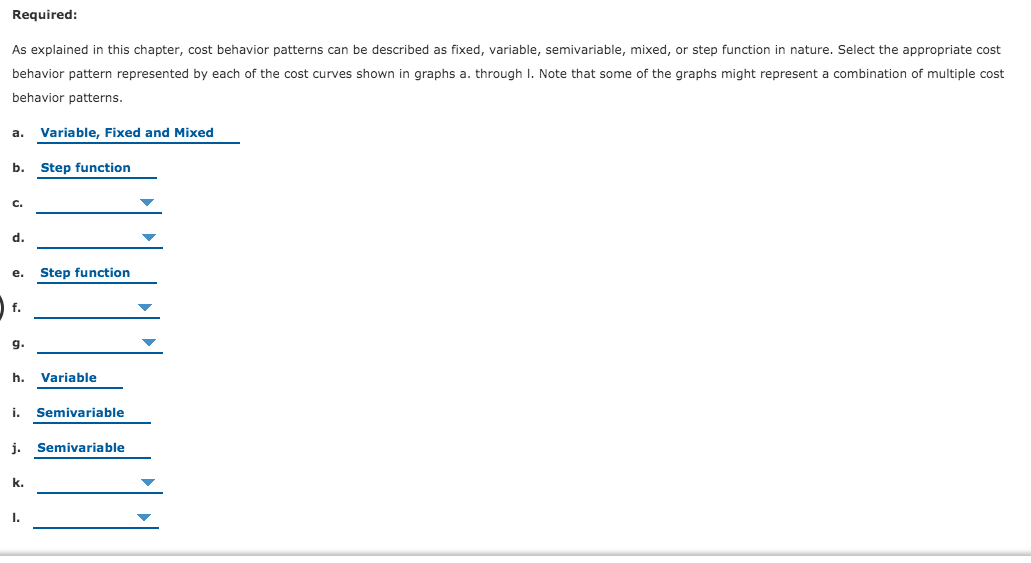
Interpreting Cost Behavior Graphs The graphs below represent cost behavior patterns that might occur in a company's cost structure. The vertical axis represents total cost, and the horizontal axis represents activity output. b. d. f. h. k. 1. Required: As explained in this chapter, cost behavior patterns can be described as fixed, variable, semivariable, mixed, or step function in nature. Select the appropriate cost behavior pattern represented by each of the cost curves shown in graphs a. through I. Note that some of the graphs might represent a combination of multiple cost behavior patterns. a. Variable, Fixed and Mixed b. Step function c. d. e. Step function f. g. h. Variable i. Semivariable j. Semivariable k. 1
Step by Step Solution
There are 3 Steps involved in it

Get step-by-step solutions from verified subject matter experts