

Question: Exercise 4 Create the following signal variables for 0 ts 10 sec, with.1 sec spacing: 1) x(t)=cos(5t) 2) y(t)e-2t 3) z(t) x(t) y(t) Plot x(t)
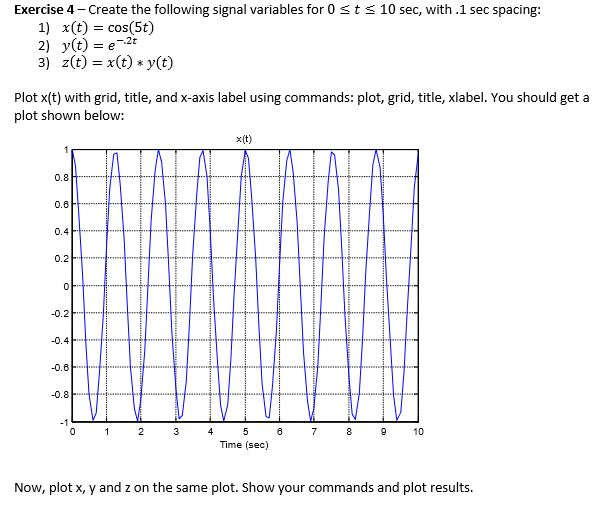
Exercise 4 Create the following signal variables for 0 ts 10 sec, with.1 sec spacing: 1) x(t)=cos(5t) 2) y(t)e-2t 3) z(t) x(t) y(t) Plot x(t) with grid, title, and x-axis label using commands: plot, grid, title, xlabel. You should get a plot shown below: x(t) 0.8 0.8 0.2 -0.4 Time (sec) Now, plot x, y and z on the same plot. Show your commands and plot results
Step by Step Solution
There are 3 Steps involved in it
1 Expert Approved Answer
Step: 1 Unlock

Question Has Been Solved by an Expert!
Get step-by-step solutions from verified subject matter experts
Step: 2 Unlock
Step: 3 Unlock