

Question: Exercise 4 Plot y=sin(8x) in red with a solid line and the Taylor polynomial approximation z=8x3256x3 in blue with a dashed line for 8x8 on
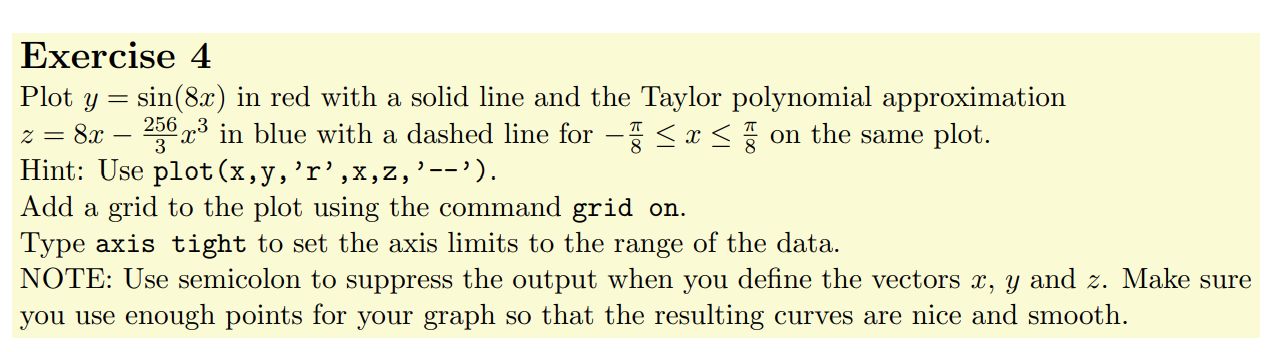
Exercise 4 Plot y=sin(8x) in red with a solid line and the Taylor polynomial approximation z=8x3256x3 in blue with a dashed line for 8x8 on the same plot. Add a grid to the plot using the command grid on. Type axis tight to set the axis limits to the range of the data. NOTE: Use semicolon to suppress the output when you define the vectors x,y and z. Make sure you use enough points for your graph so that the resulting curves are nice and smooth
Step by Step Solution
There are 3 Steps involved in it
1 Expert Approved Answer
Step: 1 Unlock

Question Has Been Solved by an Expert!
Get step-by-step solutions from verified subject matter experts
Step: 2 Unlock
Step: 3 Unlock