

Question: in blue with a Using the randomly generated value of a plot y = sin(ax) in red with a solid line and the Taylor approximation

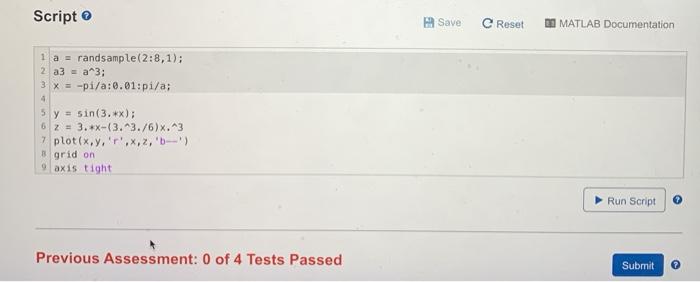
in blue with a Using the randomly generated value of a plot y = sin(ax) in red with a solid line and the Taylor approximation 2 = ax - dashed line tor - sxs on the same plot. The x-values have already been detined for you. Hint Use plot(x.y, 'r',X,2, 'b--). Add a grid to the plot using the command grid on. Type axis tight to set the axis limits to the range of the data Script Save e Reset 1 MATLAB Documentation 1 a = randsample(2:8,1); 2 a3 = a^3; 3 X = -pi/a:0.01:pi/a; 4 5 y = sin(3.*): 62 = 3. *X-(3.43./6).^3 7 plot(x,y,r',X,2,'.-) grid on 9 axis tight Run Script Previous Assessment: 0 of 4 Tests Passed Submit
Step by Step Solution
There are 3 Steps involved in it
1 Expert Approved Answer
Step: 1 Unlock

Question Has Been Solved by an Expert!
Get step-by-step solutions from verified subject matter experts
Step: 2 Unlock
Step: 3 Unlock