

Question: Exercise 4: Reading R Output Output from the Cross Table() Function Cell Contents Count Expected Values Chi-square contribution Note that the R Row Percent Column
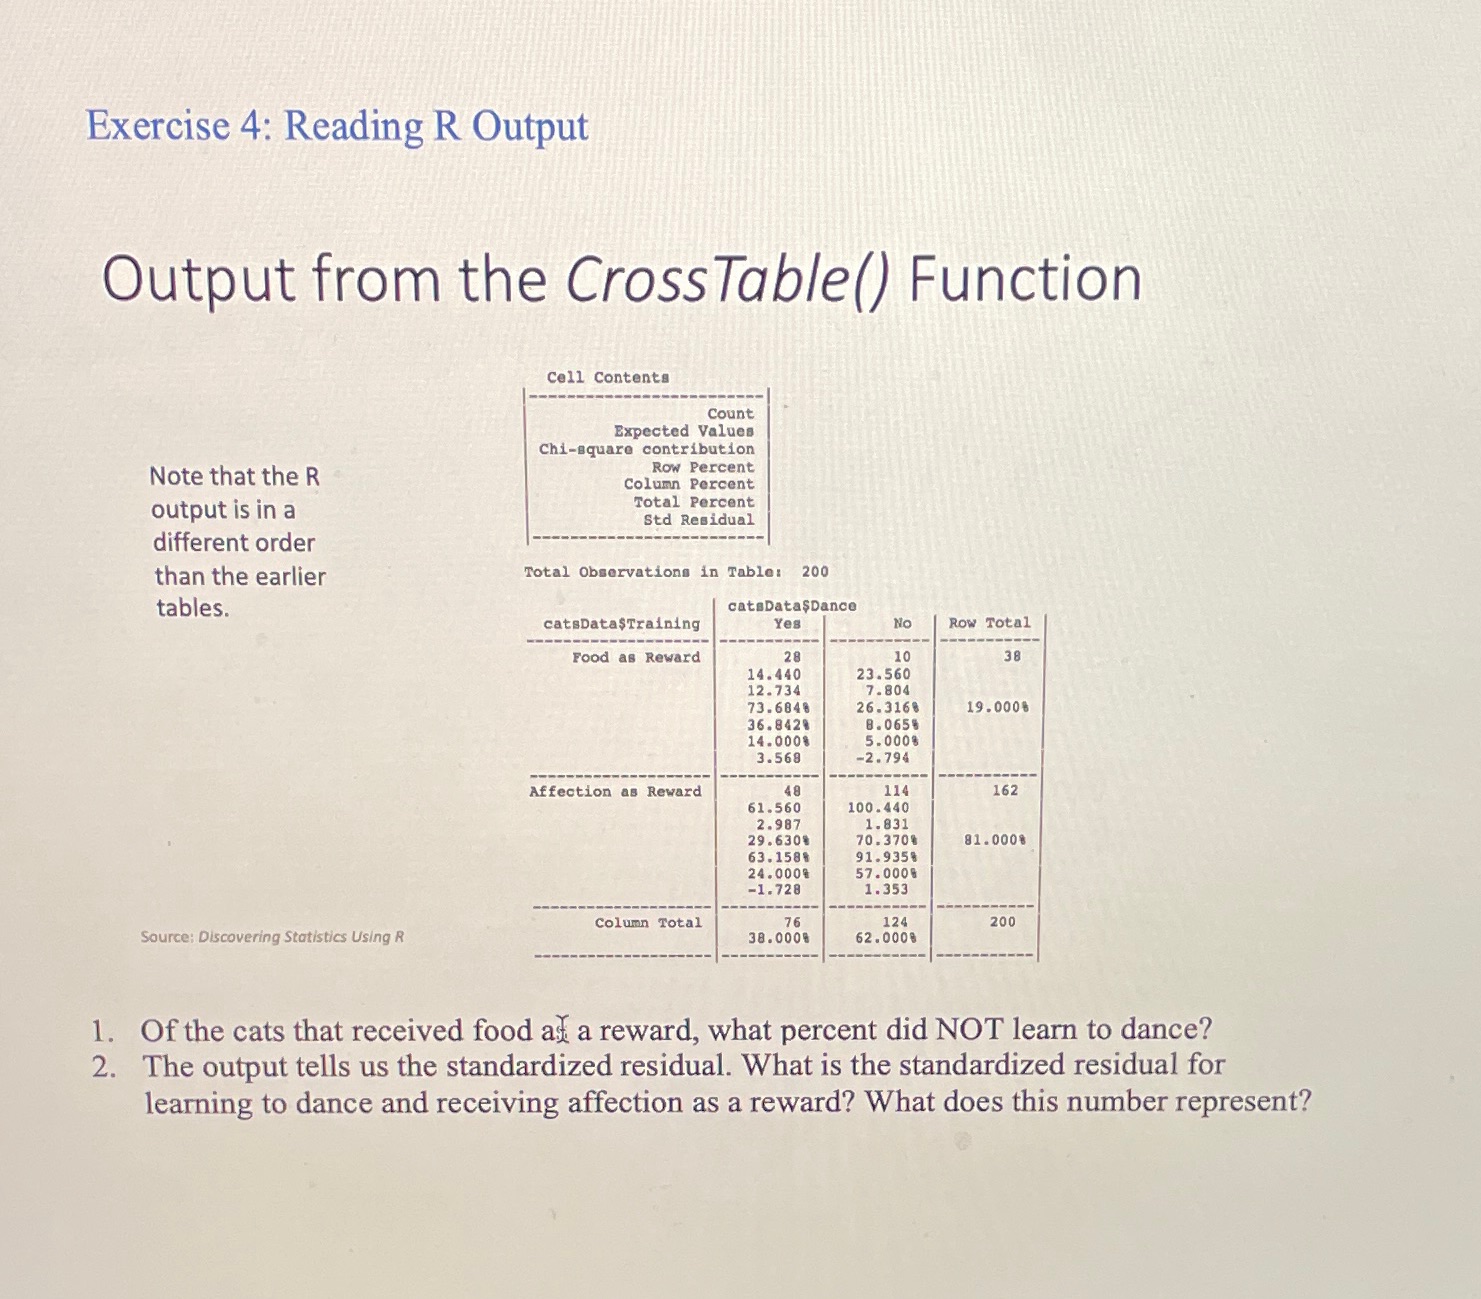
Exercise 4: Reading R Output Output from the Cross Table() Function Cell Contents Count Expected Values Chi-square contribution Note that the R Row Percent Column Percent output is in a Total Percent Std Residual different order than the earlier Total Observations in Table: 200 tables. catsData$Dance catsData$Training Yes No Row Total Food as Reward 28 10 38 14. 440 23.560 12.734 7. 804 73. 6848 26.3168 19.0008 36.8421 8. 0656 14.0008 5.0008 3.568 -2. 794 Affection as Reward 48 114 162 61.560 100 .440 2.987 1. 831 29. 6308 70.370% 81.0008 63. 1581 91.9354 24.0001 57 .000 -1. 728 1.353 Column Total 76 124 200 Source: Discovering Statistics Using R 38 . 0008 62.0008 1. Of the cats that received food at a reward, what percent did NOT learn to dance? 2. The output tells us the standardized residual. What is the standardized residual for learning to dance and receiving affection as a reward? What does this number represent
Step by Step Solution
There are 3 Steps involved in it

Get step-by-step solutions from verified subject matter experts