

Question: someone pls solve this assignment for me asap 2. The following graph shows online retail sales in the St. Louis area from 2000-2018. Month 0
someone pls solve this assignment for me asap
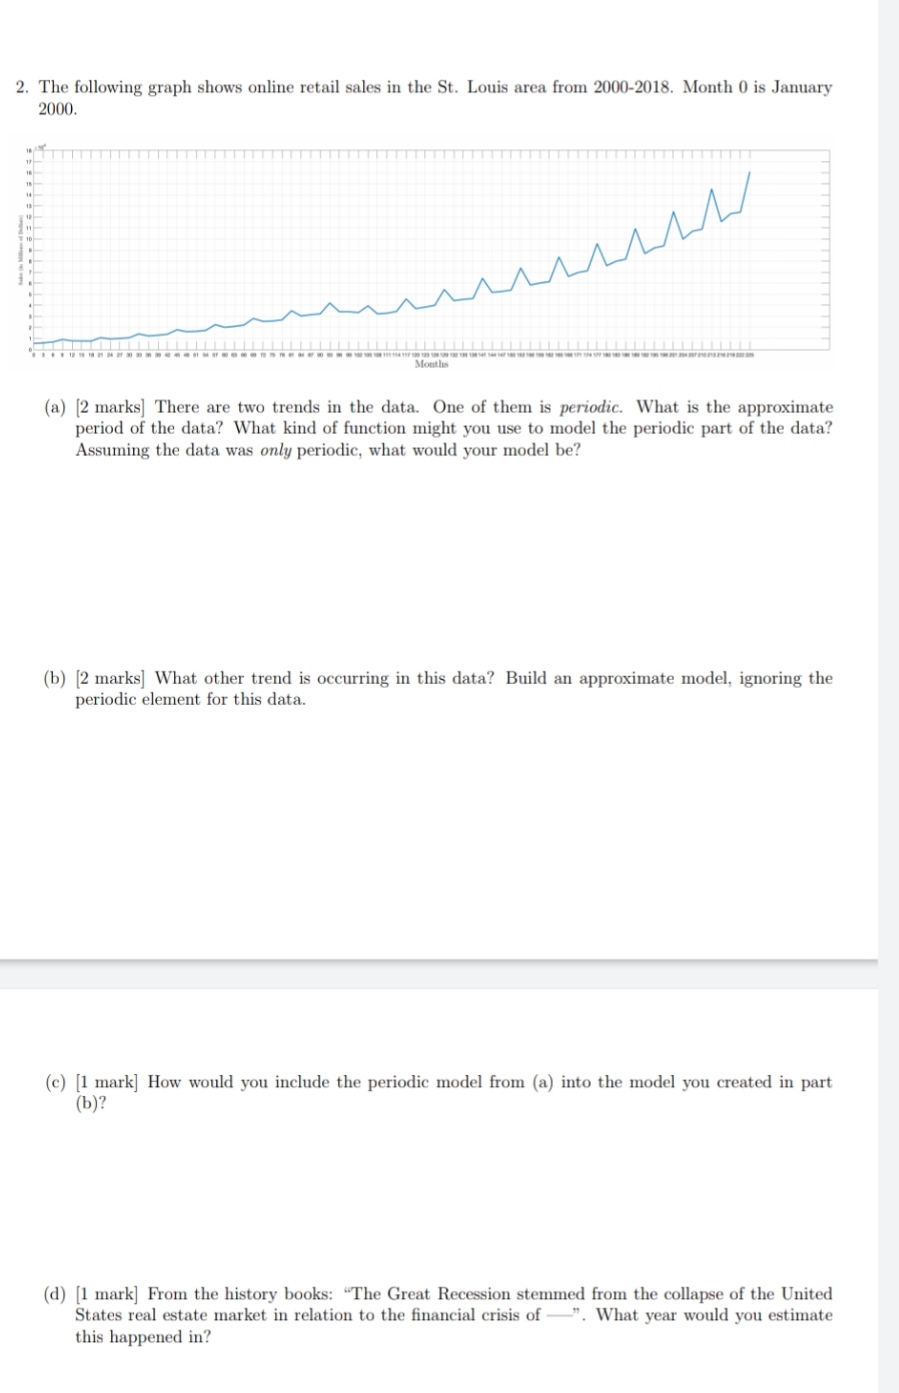
2. The following graph shows online retail sales in the St. Louis area from 2000-2018. Month 0 is January 2000. (a) [2 marks] There are two trends in the data. One of them is periodic. What is the approximate period of the data? What kind of function might you use to model the periodic part of the data? Assuming the data was only periodic, what would your model be? (b) [2 marks] What other trend is occurring in this data? Build an approximate model, ignoring the periodic element for this data. (c) [1 mark] How would you include the periodic model from (a) into the model you created in part (b)? (d) [1 mark] From the history books: "The Great Recession stemmed from the collapse of the United States real estate market in relation to the financial crisis of -". What year would you estimate this happened in
Step by Step Solution
There are 3 Steps involved in it

Get step-by-step solutions from verified subject matter experts