

Question: Exercise 4.1 (plotpoints.py) Plot the following points. Add labels, a title, and an annotation to the plot as shown in the example. Make sure to
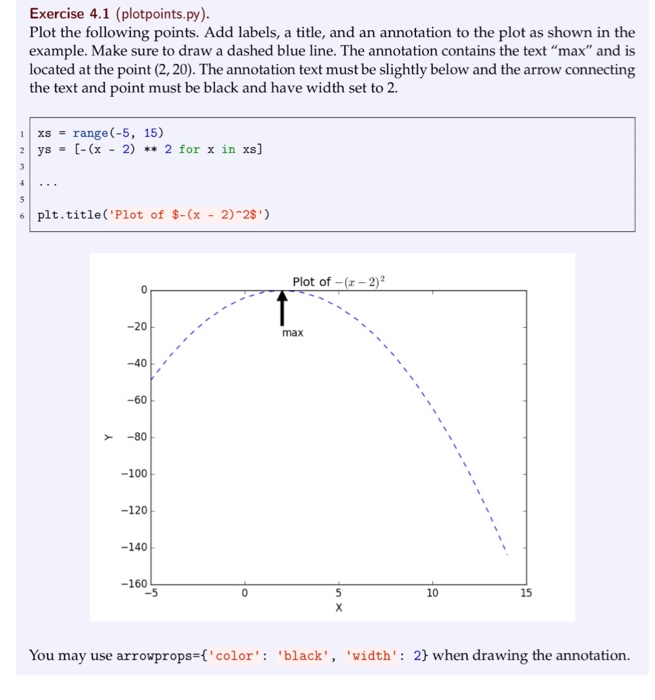
Exercise 4.1 (plotpoints.py) Plot the following points. Add labels, a title, and an annotation to the plot as shown in the example. Make sure to draw a dashed blue line. The annotation contains the text "max" and is located at the point (2,20). The annotation text must be slightly below and the arrow connecting the text and point must be black and have width set to 2. 11 xs= range (-5, 15) 2 ys -(x - 2) 2 for x in xs] 61 plt, title('Plot of $-(x - 2)^2S') Plot of -(r 2)2 max -40 -60 -80 -100 -120 -140 -160 10 15 You may use arrowprops-'color 'black', 'width': 2 when drawing the annotation
Step by Step Solution
There are 3 Steps involved in it
1 Expert Approved Answer
Step: 1 Unlock

Question Has Been Solved by an Expert!
Get step-by-step solutions from verified subject matter experts
Step: 2 Unlock
Step: 3 Unlock