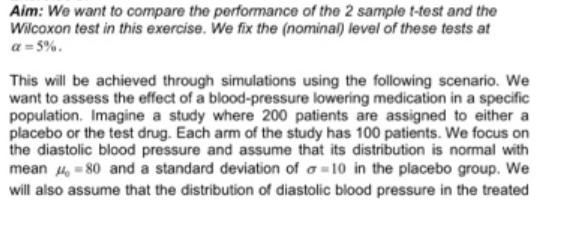
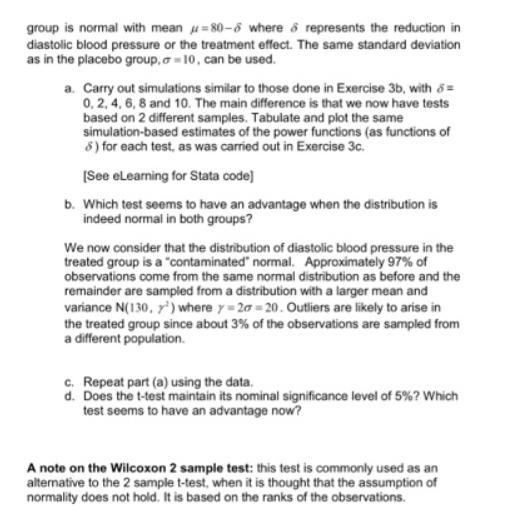
Aim: We want to compare the performance of the 2 sample t-test and the Wilcoxon test...
Fantastic news! We've Found the answer you've been seeking!
Question:
Transcribed Image Text:
Aim: We want to compare the performance of the 2 sample t-test and the Wilcoxon test in this exercise. We fix the (nominal) level of these tests at a=5%. This will be achieved through simulations using the following scenario. We want to assess the effect of a blood-pressure lowering medication in a specific population. Imagine a study where 200 patients are assigned to either a placebo or the test drug. Each arm of the study has 100 patients. We focus on the diastolic blood pressure and assume that its distribution is normal with mean = 80 and a standard deviation of 10 in the placebo group. We will also assume that the distribution of diastolic blood pressure in the treated group is normal with mean =80-8 where & represents the reduction in diastolic blood pressure or the treatment effect. The same standard deviation as in the placebo group, a-10, can be used. a. Carry out simulations similar to those done in Exercise 3b, with d= 0, 2, 4, 6, 8 and 10. The main difference is that we now have tests based on 2 different samples. Tabulate and plot the same simulation-based estimates of the power functions (as functions of 8) for each test, as was carried out in Exercise 3c. [See eLearning for Stata code] b. Which test seems to have an advantage when the distribution is indeed normal in both groups? We now consider that the distribution of diastolic blood pressure in the treated group is a "contaminated" normal. Approximately 97% of observations come from the same normal distribution as before and the remainder are sampled from a distribution with a larger mean and variance N(130, y) where y=20-20. Outliers are likely to arise in the treated group since about 3% of the observations are sampled from a different population. c. Repeat part (a) using the data. d. Does the t-test maintain its nominal significance level of 5%? Which test seems to have an advantage now? A note on the Wilcoxon 2 sample test: this test is commonly used as an alternative to the 2 sample t-test, when it is thought that the assumption of normality does not hold. It is based on the ranks of the observations. Aim: We want to compare the performance of the 2 sample t-test and the Wilcoxon test in this exercise. We fix the (nominal) level of these tests at a=5%. This will be achieved through simulations using the following scenario. We want to assess the effect of a blood-pressure lowering medication in a specific population. Imagine a study where 200 patients are assigned to either a placebo or the test drug. Each arm of the study has 100 patients. We focus on the diastolic blood pressure and assume that its distribution is normal with mean = 80 and a standard deviation of 10 in the placebo group. We will also assume that the distribution of diastolic blood pressure in the treated group is normal with mean =80-8 where & represents the reduction in diastolic blood pressure or the treatment effect. The same standard deviation as in the placebo group, a-10, can be used. a. Carry out simulations similar to those done in Exercise 3b, with d= 0, 2, 4, 6, 8 and 10. The main difference is that we now have tests based on 2 different samples. Tabulate and plot the same simulation-based estimates of the power functions (as functions of 8) for each test, as was carried out in Exercise 3c. [See eLearning for Stata code] b. Which test seems to have an advantage when the distribution is indeed normal in both groups? We now consider that the distribution of diastolic blood pressure in the treated group is a "contaminated" normal. Approximately 97% of observations come from the same normal distribution as before and the remainder are sampled from a distribution with a larger mean and variance N(130, y) where y=20-20. Outliers are likely to arise in the treated group since about 3% of the observations are sampled from a different population. c. Repeat part (a) using the data. d. Does the t-test maintain its nominal significance level of 5%? Which test seems to have an advantage now? A note on the Wilcoxon 2 sample test: this test is commonly used as an alternative to the 2 sample t-test, when it is thought that the assumption of normality does not hold. It is based on the ranks of the observations.
Expert Answer:
Answer rating: 100% (QA)
a To carry out simulations similar to Exercise 3b we need to perform the following steps 1 Define the parameters Mean of the control group 80 Standard deviation of the control group 10 Mean of the tre... View the full answer
Related Book For
Value at Risk The New Benchmark for Managing Financial Risk
ISBN: 978-0071464956
3rd edition
Authors: Philippe Jorion
Posted Date:
Students also viewed these accounting questions
-
To help you understand and compare the performance of two companies in the same industry. Find the Columbia Sportswear Company Annual Report located in Appendix A, and go to the financial statements...
-
Compare the performance of write operations achieved by a RAID Level 5 organization with that achieved by a RAID Level 1 organization.
-
Compare the performance of C-SCAN and SCAN scheduling, assuming a uniform distribution of requests. Consider the average response time (the time between the arrival of a request and the completion of...
-
Golf ball manufacturer Trevino is generally regarded as the industry leader. It commands a 40 percent market share in its targeted channels of distribution and reported net profits of $31.5 million...
-
a. Using the graph, estimate the predicted price for a home with 3000 square feet. b. Use the equation to predict the price for a home with 3000 square feet. Predicted Price =-11.77 + 0.1146 Sqft 700...
-
If Z is a random variable having the standard normal distribution, find the respective values z1, z2, z3, and z4 such that (a) P(0 < Z < z1) = 0.4306; (b) P(Z z2) = 0.7704; (c) P(Z > z3) = 0.2912;...
-
For each of the following, (a) calculate the mean, standard deviation, and standard error of the mean for each Group and (b) construct a bar graph (assume the independent variable is condition and...
-
Explore the social media links on the kiwiexperience.com home page. a. What are you initial reactions? Does the layout and concept invite you to participate and provide your own content? b. This Web...
-
Required information [The following information applies to the questions displayed below.] The following information pertains to Trenton Glass Works for the year just ended. Budgeted direct-labor...
-
Montreal Electronics Company manufactures two large-screen television models: the Nova, which has been produced for 10 years and sells for $900, and the Royal, a new model introduced in early 20x0,...
-
Read the Case Study Alan Mulallys Restructuring of Ford Motor Company 1. What are the key structural issues that Alan Mulally encountered as the incoming President and CEO of Ford Motor Company? 2....
-
Standing on the edge of a rotating playground carousel, you take sight on the center of the carousel and walk directly toward that position. (a) What happens to the rotational speed of the carousel...
-
Why do quarterbacks throw the football with significant spin about its long axis?
-
A solid \(50-\mathrm{kg}\) cylinder has a radius of \(0.10 \mathrm{~m}\). What \(\mathrm{min}-\) imum work is required to get the cylinder rolling without slipping at a rotational speed of \(20...
-
Imagine that an asteroid \(1 \mathrm{~km}\) in diameter collides with Earth. Estimate the maximum fractional change in the length of the day due to this collision.
-
Is the distribution of those digits a normal distribution? Why or why not?
-
Figure shows the equilateral triangular truss structure with the boundary conditions and loadings as shown. All the truss members have a uniform cross-section of 100 mm and are made from aluminum...
-
Determine which of the following limits exist. Compute the limits that exist. lim x-0 1- + 3x X
-
Just to be sure, the risk manager runs a regression of the Japanese stocks on U.S. stocks and finds a slope coefficient of 0.9. Assuming that a shock of 20 percent originates from the United States,...
-
A portfolio manager invests in the U.S. and euro bond markets. Returns are measured in dollars. How many important factors are likely to show up in a principal components analysis applied to these...
-
Under what circumstances would a user be better off using a timesharing system rather than a PC or single-user workstation?
-
Test the overall significance of a regression model and identify the components of this test from your computer output.
-
Identify the sample.
-
Based on the strategy, what type of sampling technique will be used to identify the sample? a. Why did you choose this type of technique?
Study smarter with the SolutionInn App