

Question: Exercise 6 (3 points) Difficulty: Easy In this exercise, you will plot figures in xy-plane and consider their images under the transformations of the plane
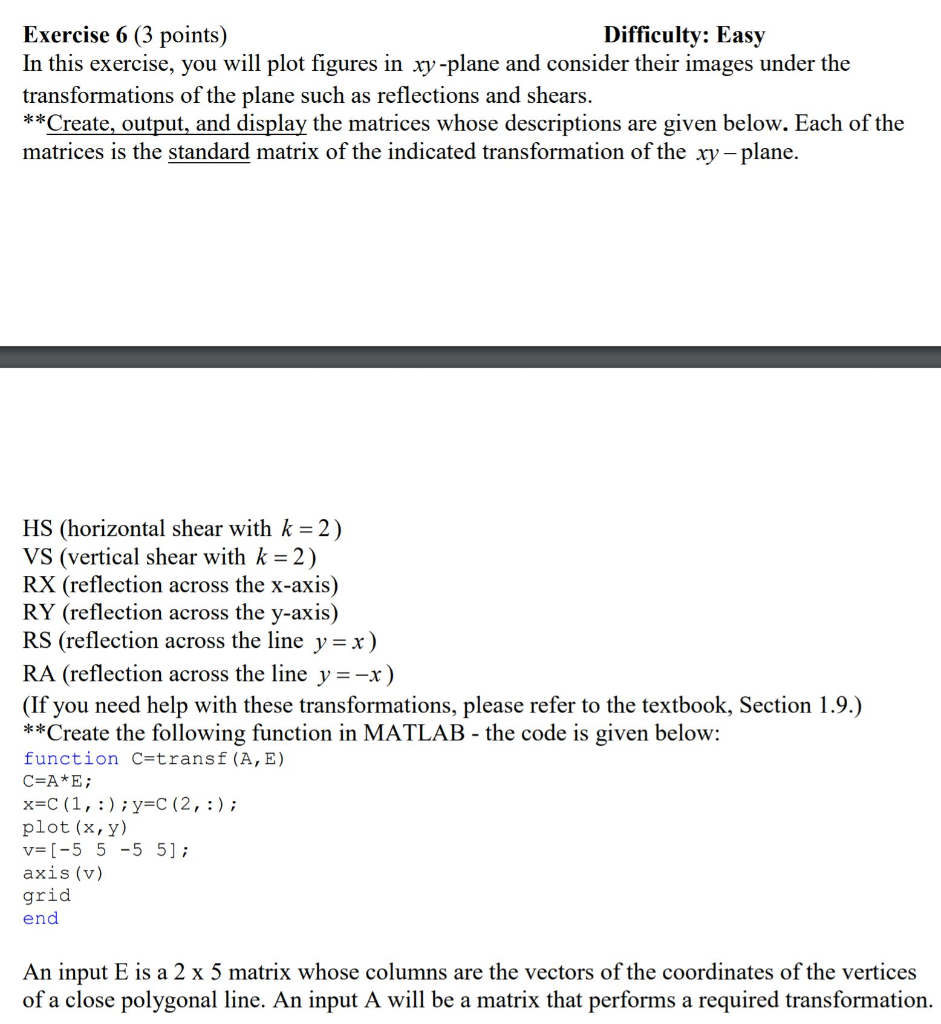
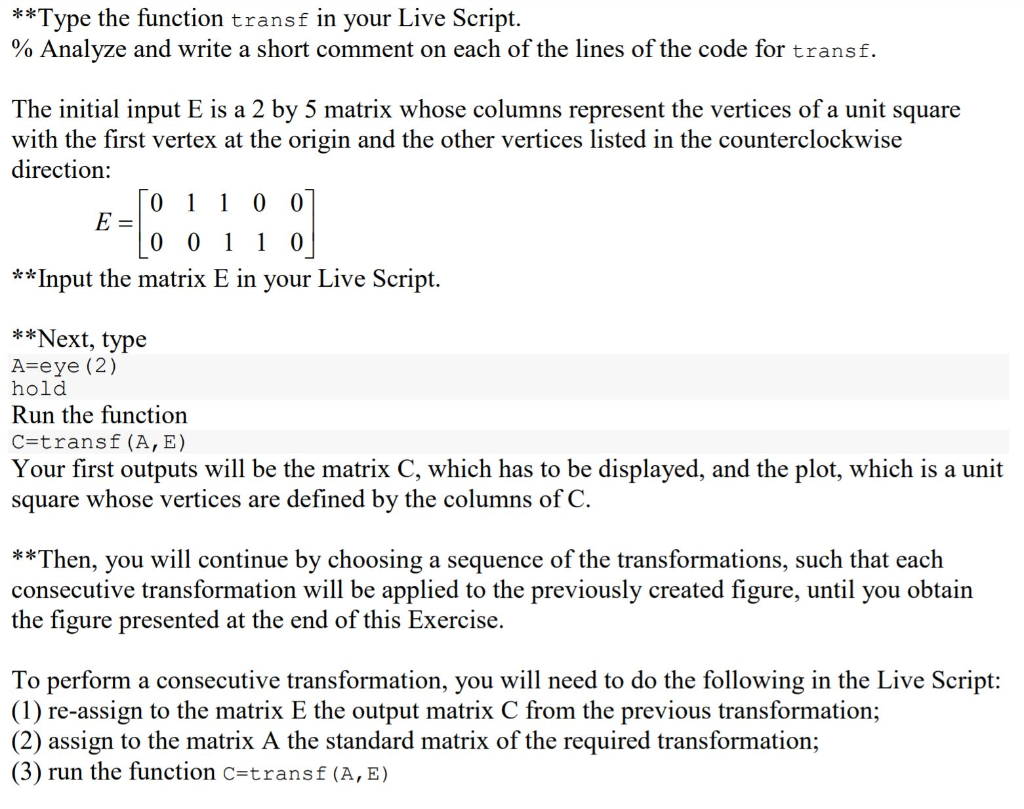
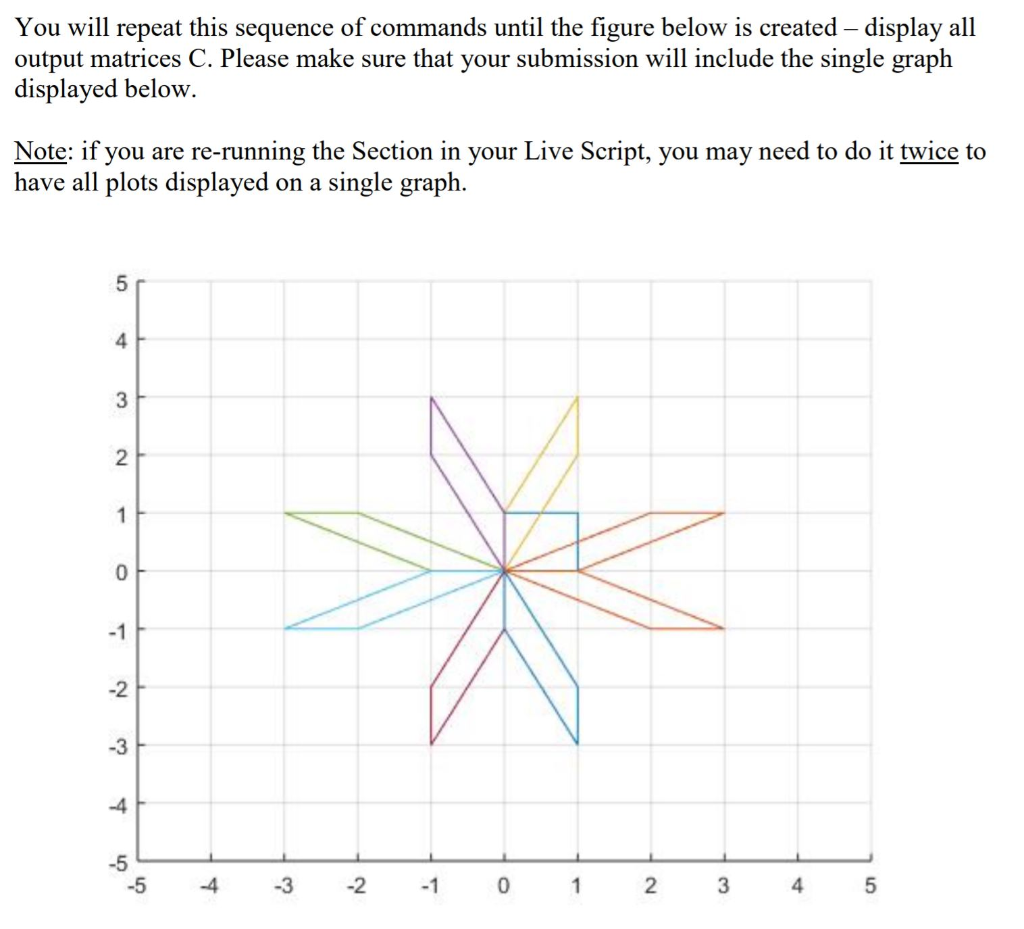
Exercise 6 (3 points) Difficulty: Easy In this exercise, you will plot figures in xy-plane and consider their images under the transformations of the plane such as reflections and shears. **Create, output, and display the matrices whose descriptions are given below. Each of the matrices is the standard matrix of the indicated transformation of the xy - plane. HS (horizontal shear with k = 2) VS (vertical shear with k = 2) RX (reflection across the x-axis) RY (reflection across the y-axis) RS (reflection across the line y = x) RA (reflection across the line y=-x) (If you need help with these transformations, please refer to the textbook, Section 1.9.) **Create the following function in MATLAB - the code is given below: function C=transf (A, E) C=A*E; x=C(1,:);y=C(2,:); plot (x,y) v=[-5 5 -5 5]; axis (v) grid end An input E is a 2 x 5 matrix whose columns are the vectors of the coordinates of the vertices of a close polygonal line. An input A will be a matrix that performs a required transformation. **Type the function transf in your Live Script. % Analyze and write a short comment on each of the lines of the code for transf. The initial input E is a 2 by 5 matrix whose columns represent the vertices of a unit square with the first vertex at the origin and the other vertices listed in the counterclockwise direction: 0 1 1 0 0] E- 0 0 1 1 0 **Input the matrix E in your Live Script. **Next, type A=eye (2) hold Run the function C=transf (A, E) Your first outputs will be the matrix C, which has to be displayed, and the plot, which is a unit square whose vertices are defined by the columns of C. **Then, you will continue by choosing a sequence of the transformations, such that each consecutive transformation will be applied to the previously created figure, until you obtain the figure presented at the end of this Exercise. To perform a consecutive transformation, you will need to do the following in the Live Script: (1) re-assign to the matrix E the output matrix C from the previous transformation; (2) assign to the matrix A the standard matrix of the required transformation; (3) run the function C=transf (A,E) You will repeat this sequence of commands until the figure below is created display all output matrices C. Please make sure that your submission will include the single graph displayed below. Note: if you are re-running the Section in your Live Script, you may need to do it twice to have all plots displayed on a single graph. -5 4 -3 -2 -1 0 1 2 3 4 5 Exercise 6 (3 points) Difficulty: Easy In this exercise, you will plot figures in xy-plane and consider their images under the transformations of the plane such as reflections and shears. **Create, output, and display the matrices whose descriptions are given below. Each of the matrices is the standard matrix of the indicated transformation of the xy - plane. HS (horizontal shear with k = 2) VS (vertical shear with k = 2) RX (reflection across the x-axis) RY (reflection across the y-axis) RS (reflection across the line y = x) RA (reflection across the line y=-x) (If you need help with these transformations, please refer to the textbook, Section 1.9.) **Create the following function in MATLAB - the code is given below: function C=transf (A, E) C=A*E; x=C(1,:);y=C(2,:); plot (x,y) v=[-5 5 -5 5]; axis (v) grid end An input E is a 2 x 5 matrix whose columns are the vectors of the coordinates of the vertices of a close polygonal line. An input A will be a matrix that performs a required transformation. **Type the function transf in your Live Script. % Analyze and write a short comment on each of the lines of the code for transf. The initial input E is a 2 by 5 matrix whose columns represent the vertices of a unit square with the first vertex at the origin and the other vertices listed in the counterclockwise direction: 0 1 1 0 0] E- 0 0 1 1 0 **Input the matrix E in your Live Script. **Next, type A=eye (2) hold Run the function C=transf (A, E) Your first outputs will be the matrix C, which has to be displayed, and the plot, which is a unit square whose vertices are defined by the columns of C. **Then, you will continue by choosing a sequence of the transformations, such that each consecutive transformation will be applied to the previously created figure, until you obtain the figure presented at the end of this Exercise. To perform a consecutive transformation, you will need to do the following in the Live Script: (1) re-assign to the matrix E the output matrix C from the previous transformation; (2) assign to the matrix A the standard matrix of the required transformation; (3) run the function C=transf (A,E) You will repeat this sequence of commands until the figure below is created display all output matrices C. Please make sure that your submission will include the single graph displayed below. Note: if you are re-running the Section in your Live Script, you may need to do it twice to have all plots displayed on a single graph. -5 4 -3 -2 -1 0 1 2 3 4 5
Step by Step Solution
There are 3 Steps involved in it

Get step-by-step solutions from verified subject matter experts