

Question: Exercise 8-19 Algo Consider a normal population with an unknown population standard deviation. A random sample results in x? = 48.44 and s 2 =
Exercise 8-19 Algo
Consider a normal population with an unknown population standard deviation. A random sample results inx? = 48.44 and s2 = 10.89. [You may find it useful to reference the t table.] a. Compute the 90% confidence interval for ? ifx? and s2 were obtained from a sample of 7 observations. (Round final answer to 2 decimal places.)
b. Compute the 90% confidence interval for ? ifx? and s2 were obtained from a sample of 19 observations. (Round final answer to 2 decimal places.) c. Use your answers to discuss the impact of the sample size on the width of the interval. multiple choice
- The bigger sample size will lead to a larger interval width and therefore a more precise interval.
- The bigger sample size will lead to a smaller interval width and therefore a more precise interval.
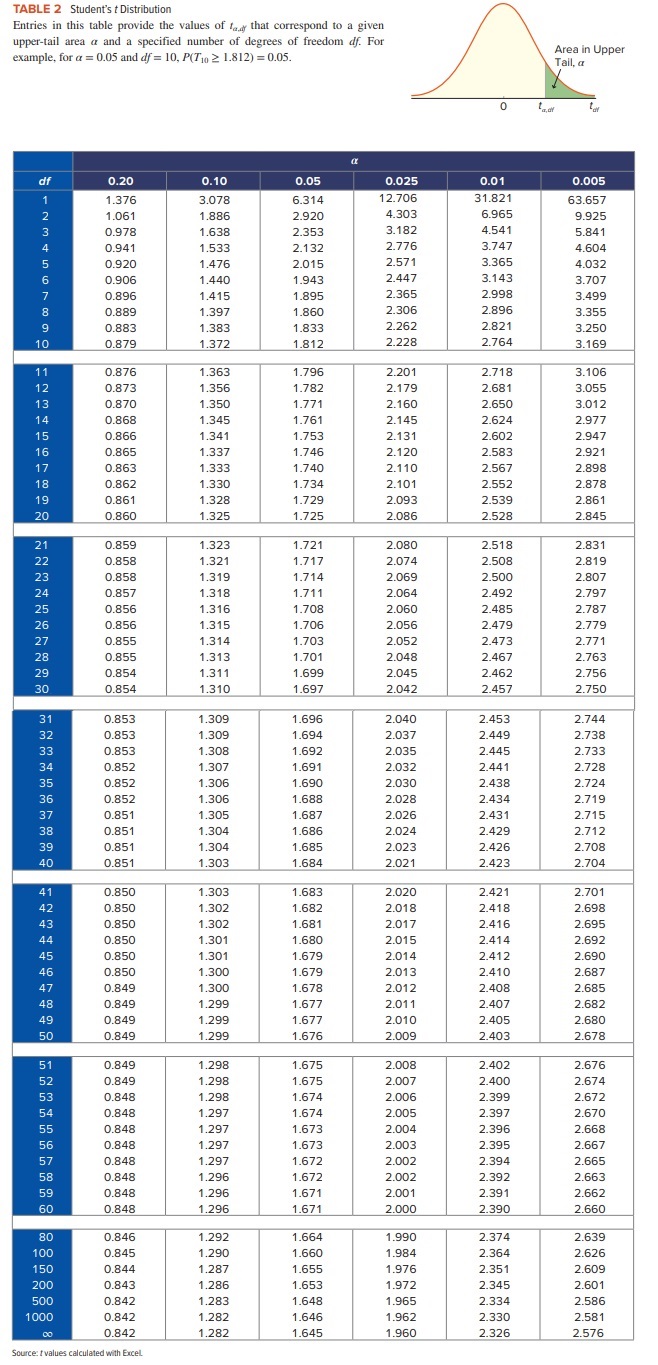
TABLE 2 Student's t Distribution Entries in this table provide the values of fay that correspond to a given upper-tail area a and a specified number of degrees of freedom df. For example, for a = 0.05 and of = 10, P(710 2 1.812) = 0.05. Area in Upper Tail, a df 0.20 0. 10 0.05 0.025 0.01 0.005 1.376 3.078 6.314 12.706 31.821 63.657 1.061 1.886 2.920 4.303 6.965 9.925 0.978 1.638 2.353 3.182 4.541 5.841 0.941 1.533 2.132 2.776 3.747 4.604 0.920 1.476 2.015 2.571 3.365 4.032 0.906 1.440 1.943 2.447 3.143 3.707 0.896 1.415 1.895 2.365 2.998 3.499 00 0.889 1.397 1.860 2.306 2.896 3.355 0.883 1.383 1.833 2.262 2.821 3.250 10 0.879 1.372 1.812 2.228 2.764 3.169 11 0.876 1.363 1.796 2.201 2.718 3.106 12 0.873 1.356 1.782 2.179 2.681 3.055 13 0.870 1.350 1.771 2.160 2.650 3.012 14 0.868 1.345 1.761 2.145 2.624 2.977 15 0.866 1.341 1.753 2.131 2.602 2.947 16 0.865 1.337 1.746 2.120 2.583 2.921 17 0.863 1.333 1.740 2.110 2.567 2.898 18 0.862 1.330 1.734 2.101 2.552 2.878 19 0.861 1.328 1.729 2.093 2.539 2.861 20 0.860 1.325 1.725 2.086 2.528 2.845 21 0.859 1.323 1.721 2.080 2.518 2.831 22 0.858 1.321 1.717 2.074 2.508 2.819 23 0.858 1.319 1.714 2.069 2.500 2.807 24 0.857 1.318 1.711 2.064 2.492 2.797 25 0.856 1.316 1.708 2.060 2.485 2.787 26 0.856 1.315 1.706 2.056 2.479 2.779 27 0.855 1.314 1.703 2.052 2.473 2.771 28 0.855 1.313 1.701 2.048 2.467 2.763 29 0.854 1.311 1.699 2.045 2.462 2.756 30 0.854 1.310 1.697 2.042 2.457 2.750 31 0.853 1.309 1.696 2.040 2.453 2.744 32 0.853 1.309 1.694 2.037 2.449 2.738 33 0.853 1.308 1.692 2.035 2.445 2.733 34 0.852 1.307 1.691 2.032 2.441 2.728 35 0.852 1.306 1.690 2.030 2.438 2.724 36 0.852 1.306 1.688 2.028 2.434 2.719 37 0.851 1.305 1.687 2.026 2.431 2.715 38 0.851 1.304 1.686 2.024 2.429 2.712 39 0.851 1.304 1.685 2.023 2.426 2.708 40 0.851 1.303 1.684 2.021 2.423 2.704 41 0.850 1.303 1.683 2.020 2.421 2.701 42 0.850 1.302 1.682 2.018 2.418 2.698 43 0.850 1.302 1.681 2.017 2.416 2.695 44 0.850 1.301 1.680 2.015 2.414 2.692 45 0.850 1.301 1.679 2.014 2.412 2.690 46 0.850 1.300 1.679 2.013 2.410 2.687 47 0.849 1.300 1.678 2.012 2.408 2.685 48 0.849 1.299 1.677 2.011 2.407 2.682 49 0.849 1.299 1.677 2.010 2.405 2.680 50 0.849 1.299 1.676 2.009 2.403 2.678 51 0.849 1.298 1.675 2.008 2.402 2.676 52 0.849 1.298 1.675 2.007 2.400 2.674 53 0.848 1.298 1.674 2.006 2.399 2.672 54 0.848 1.297 1.674 2.005 2.397 2.670 55 0.848 1.297 1.673 2.004 2.396 2.668 56 0.848 1.297 1.673 2.003 2.395 2.667 57 0.848 1.297 1.672 2.002 2.394 2.665 58 0.848 1.296 1.672 2.002 2.392 2.663 59 0.848 1.296 1.671 2.001 2.391 2.662 60 0.848 1.296 1.671 2.000 2.390 2.660 80 0.846 1.292 1.664 1.990 2.374 2.639 100 0.845 1.290 1.660 1.984 2.364 2.626 150 0.844 1.287 1.655 1.976 2.351 2.609 200 0.843 1.286 1.653 1.972 2.345 2.601 500 0.842 1.283 1.648 1.965 2.334 2.586 1000 0.842 1.282 1.646 1.962 2.330 2.581 0.842 1.282 1.645 1.960 2.326 2.576 Source: I values calculated with Excel
Step by Step Solution
There are 3 Steps involved in it

Get step-by-step solutions from verified subject matter experts