

Question: Exercise 9-23 Ratio analysis CHECK FIGURES d. 2019: $0.72 k. 2018: 5.47 times The following financial statements apply to Karl Company: Page 359 Required Calculate
Exercise 9-23 Ratio analysis
CHECK FIGURES
d. 2019: $0.72
k. 2018: 5.47 times
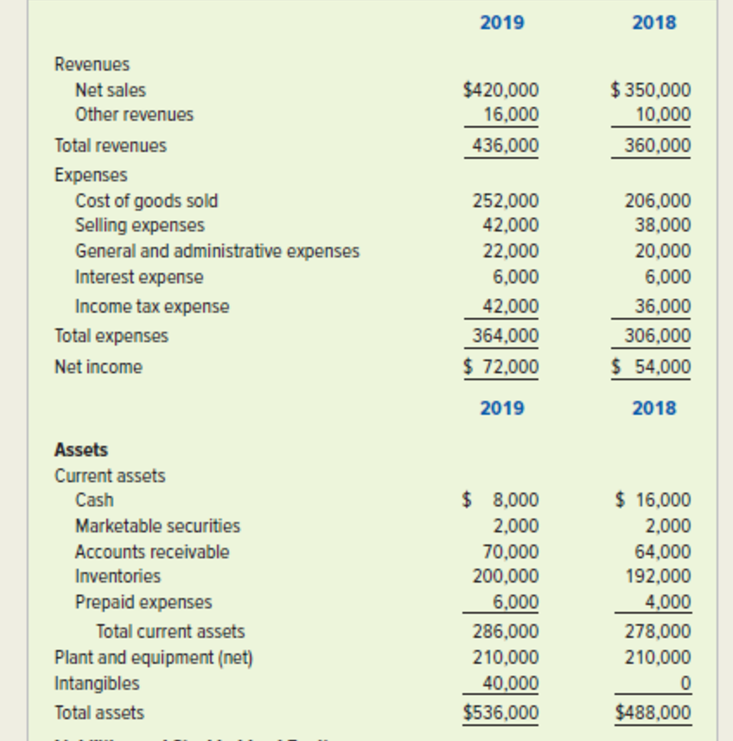
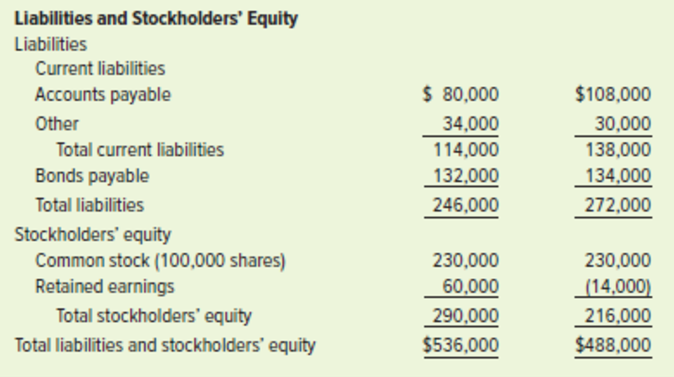
The following financial statements apply to Karl Company:
Page 359
Required
Calculate the following ratios for 2018 and 2019. When data limitations prohibit computing averages, use year-end balances in your calculations. Round computations to two decimal points.
Net margin.
Return on investment.
Return on equity.
Earnings per share.
Price-earnings ratio (market prices at the end of 2018 and 2019 were $11.88 and $9.54, respectively).
Book value per share of common stock.
Times interest earned.
Working capital.
Current ratio.
Quick (acid-test) ratio.
Accounts receivable turnover.
Inventory turnover.
Debt to equity ratio.
Debt to assets ratio.
2019 2018 Revenues Net sales Other revenues $420,000 16,000 436,000 350,000 10,000 360,000 Total revenues Expenses Cost of goods sold Selling expenses General and administrative expenses Interest expense Income tax expense 252,000 42,000 22,000 6,000 42,000 364,000 72,000 206,000 38,000 20,000 6,000 Total expenses Net income 36,000 306,000 S 54,000 2019 2018 Assets Current assets Cash Marketable securities Accounts receivable Inventories Prepaid expenses $ 8,000 2,000 70,000 200,000 6,000 286,000 210,000 40,000 $536,000 $ 16,000 2,000 64.000 192,000 4,000 278,000 210,000 Total current assets Plant and equipment (net) Intangibles Total assets $488,000
Step by Step Solution
There are 3 Steps involved in it

Get step-by-step solutions from verified subject matter experts