

Question: Exercise 9-4 Operating data for Pronghorn Corp are presented below. 2017 2016 Sales revenue Cost of goods sold Selling expenses Administrative expenses Income tax expense
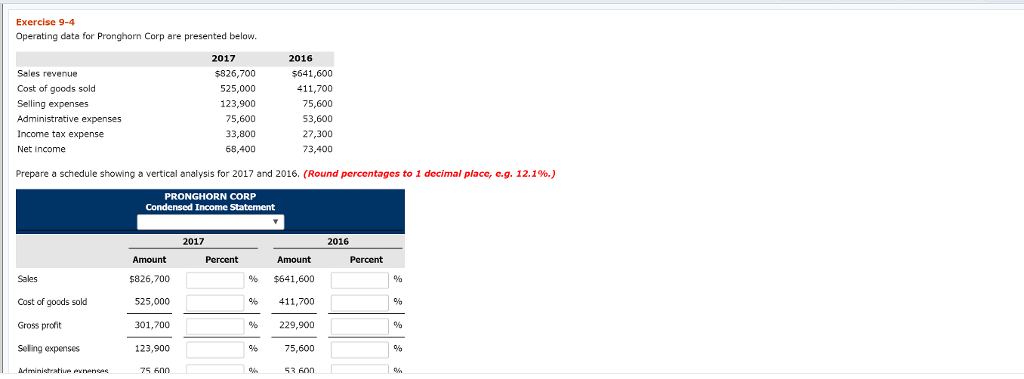
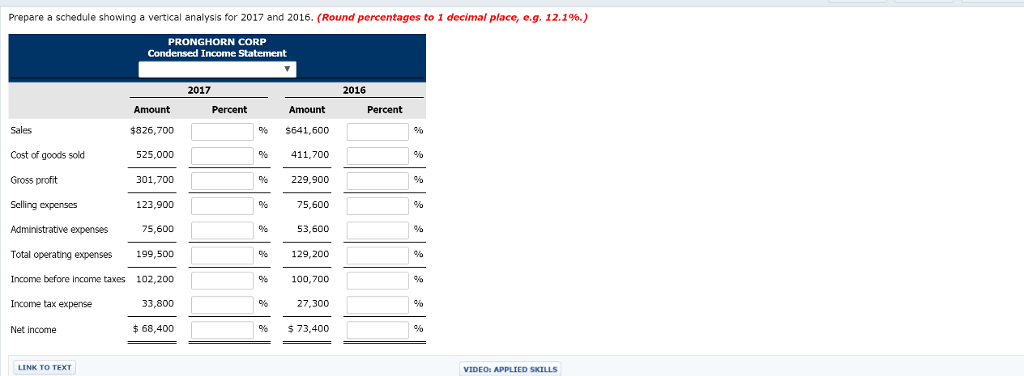
Exercise 9-4 Operating data for Pronghorn Corp are presented below. 2017 2016 Sales revenue Cost of goods sold Selling expenses Administrative expenses Income tax expense Net income $826,700 525,000 123,900 75,600 33,800 68,400 $641,600 411,700 75,600 53,600 27,300 73,400 Prepare a schedule showing a vertical analysis for 2017 and 2016, (Round percentages to 1 decimal place, eg. 12.1%.) PRONGHORN CORP 2017 2016 Amount $826,700 525,000 301,700 123,900 Percent Amount Percent Cost of goods sold Gross profit Seling expenses % $641,600 % 411,700 % 229,900 75,600 89
Step by Step Solution
There are 3 Steps involved in it
1 Expert Approved Answer
Step: 1 Unlock

Question Has Been Solved by an Expert!
Get step-by-step solutions from verified subject matter experts
Step: 2 Unlock
Step: 3 Unlock