

Question: Exercise Exercise 4: Table 4 shows the X and Y data. X Y 50 30 100 65 150 90 200 150 300 190 350 200
Exercise

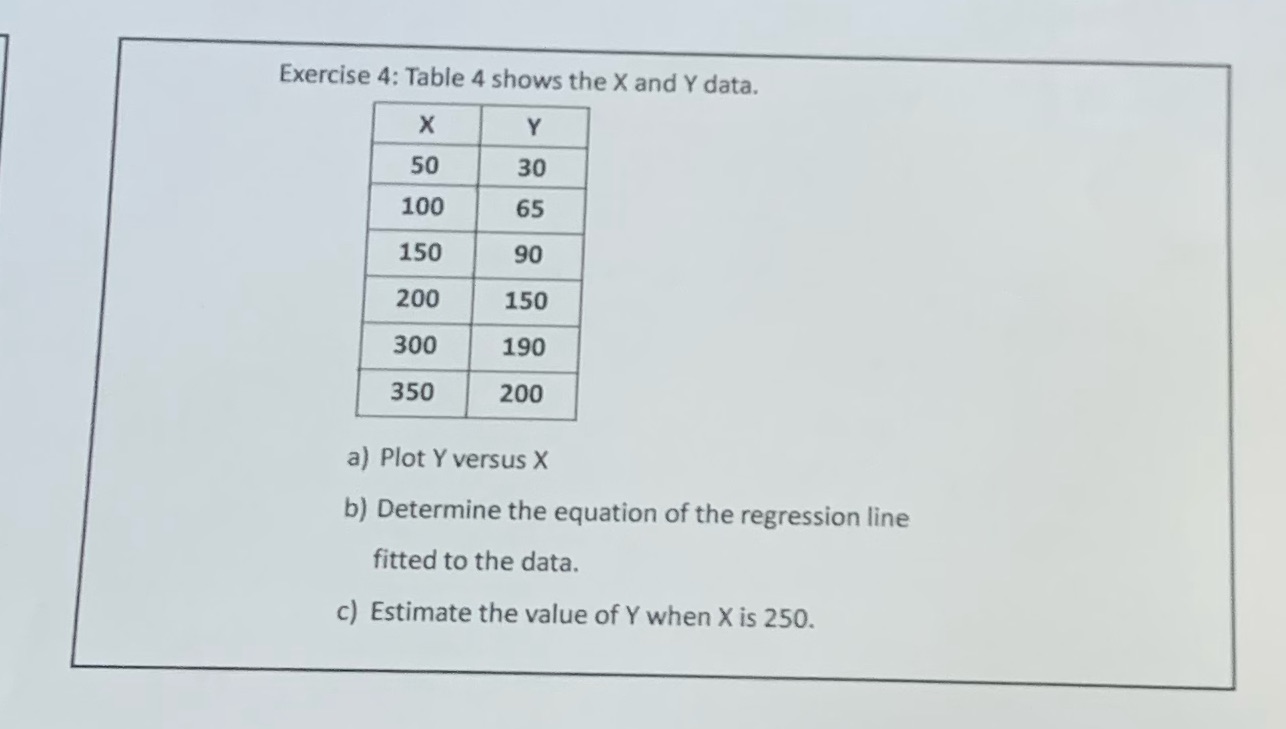
Exercise 4: Table 4 shows the X and Y data. X Y 50 30 100 65 150 90 200 150 300 190 350 200 a) Plot Y versus X b) Determine the equation of the regression line fitted to the data. c) Estimate the value of Y when X is 250
Step by Step Solution
There are 3 Steps involved in it
1 Expert Approved Answer
Step: 1 Unlock

Question Has Been Solved by an Expert!
Get step-by-step solutions from verified subject matter experts
Step: 2 Unlock
Step: 3 Unlock