

Question: Exercise Open the spreadsheet Excel_7. Create a pivot table using the data on the Pivot Table Data sheet. The pivot table should show monthly sales
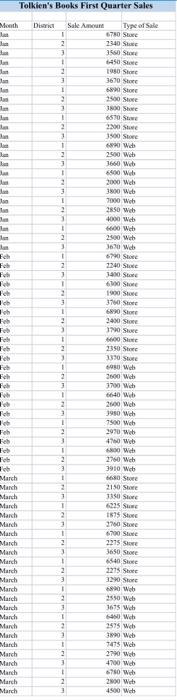
Exercise Open the spreadsheet Excel_7. Create a pivot table using the data on the Pivot Table Data sheet. The pivot table should show monthly sales based on type of sale. Create a new tab and name it Goal-Seek. On this sheet in the spreadsheet, create a goal seek what-if analysis for Tolkien's Books District 1 store sales in April. The sales for the first three weeks are: Week 1:$6,578 Week 2: $5,679 Week 3: $4,980 Find the sales needed in week 4 that will give average sales for the month of $6,000. Create a new tab and name it Scenario. On this sheet in the spreadsheet, create a Scenario for District 2 store sales in April. Create your own figures for a Target Case, Best Case, and Worst Case scenario for the four weeks in April. Tolkien's Books First Quarter Sales Month Diana Sale A 2 3 1 2 3 1 Tyd Sale 6780 Store 2340 Stan S 6450 S 1960 Store 3670 Store 680 Store 1500 Store 1800 Shwe an 1 1 2 3 1 2 3 1 3 3 1 2 1 2300 S 3500 Store 6 Wide 2500 Web 3660 Web 6800 Web 2000 Web 700 W 7000 Web 2850 Web 4000 Web Web 2500 Web 3670 W 670 Store 2340 Store Ech F F 2 3 1 2 3 1 2 3 1 ch 1 F 3 F Feb 2 1 1 2 3 1 3 Tch 10 Feh Feb To Feb 61 Store 1900 S 370 Store 6 Stone 2. So 17 Se 6000 S 10 S 3370 S Web 2000 Web 1700 With 6640 Web 2000 Web 3950 Web 7500 Web 1970 W 4780 Web O Web 2750 Web 3910 Web Se 2150 S 1150 Stone 15 S 1519 Show 2760 Store 6700 Store 2275 SE 3650 S 2 1 2 3 March March March March March March March March March March March March March March March 3 1 1 2 3 1 1 20 S Barch 1 2 3 1 3 3 1 2 3 1 2 3 March March March March March March March March 2215 State 320 Store 60 Web 2550 Web 3675 Web 60 Web 2575 Web 380 Web 745 Web 2200 Web 400 Web 670 W 2000 Web 4500 Web 2 3 Exercise Open the spreadsheet Excel_7. Create a pivot table using the data on the Pivot Table Data sheet. The pivot table should show monthly sales based on type of sale. Create a new tab and name it Goal-Seek. On this sheet in the spreadsheet, create a goal seek what-if analysis for Tolkien's Books District 1 store sales in April. The sales for the first three weeks are: Week 1:$6,578 Week 2: $5,679 Week 3: $4,980 Find the sales needed in week 4 that will give average sales for the month of $6,000. Create a new tab and name it Scenario. On this sheet in the spreadsheet, create a Scenario for District 2 store sales in April. Create your own figures for a Target Case, Best Case, and Worst Case scenario for the four weeks in April. Tolkien's Books First Quarter Sales Month Diana Sale A 2 3 1 2 3 1 Tyd Sale 6780 Store 2340 Stan S 6450 S 1960 Store 3670 Store 680 Store 1500 Store 1800 Shwe an 1 1 2 3 1 2 3 1 3 3 1 2 1 2300 S 3500 Store 6 Wide 2500 Web 3660 Web 6800 Web 2000 Web 700 W 7000 Web 2850 Web 4000 Web Web 2500 Web 3670 W 670 Store 2340 Store Ech F F 2 3 1 2 3 1 2 3 1 ch 1 F 3 F Feb 2 1 1 2 3 1 3 Tch 10 Feh Feb To Feb 61 Store 1900 S 370 Store 6 Stone 2. So 17 Se 6000 S 10 S 3370 S Web 2000 Web 1700 With 6640 Web 2000 Web 3950 Web 7500 Web 1970 W 4780 Web O Web 2750 Web 3910 Web Se 2150 S 1150 Stone 15 S 1519 Show 2760 Store 6700 Store 2275 SE 3650 S 2 1 2 3 March March March March March March March March March March March March March March March 3 1 1 2 3 1 1 20 S Barch 1 2 3 1 3 3 1 2 3 1 2 3 March March March March March March March March 2215 State 320 Store 60 Web 2550 Web 3675 Web 60 Web 2575 Web 380 Web 745 Web 2200 Web 400 Web 670 W 2000 Web 4500 Web 2 3
Step by Step Solution
There are 3 Steps involved in it

Get step-by-step solutions from verified subject matter experts