

Question: Exercise Z-Excel File Notes about this le: The file has four tabs Presentation, Analysis, SurveyData, and lssueData. The SurveyData and IssueData tabs contain the data


![link, 2 = Confused by navigation choices, etc]. The specific issues are](https://s3.amazonaws.com/si.experts.images/answers/2024/06/666a1d8a296da_409666a1d89ef8fd.jpg)
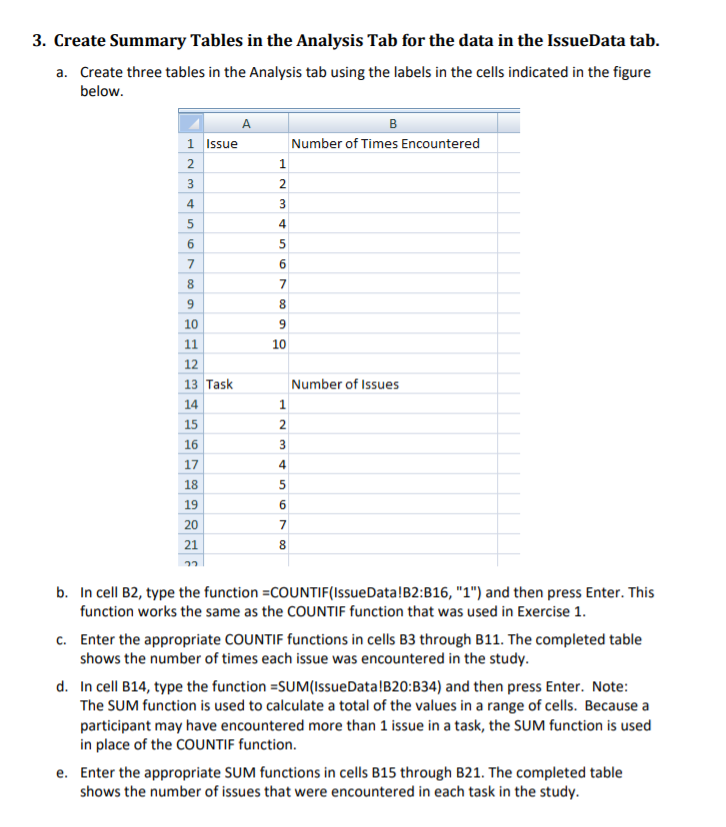
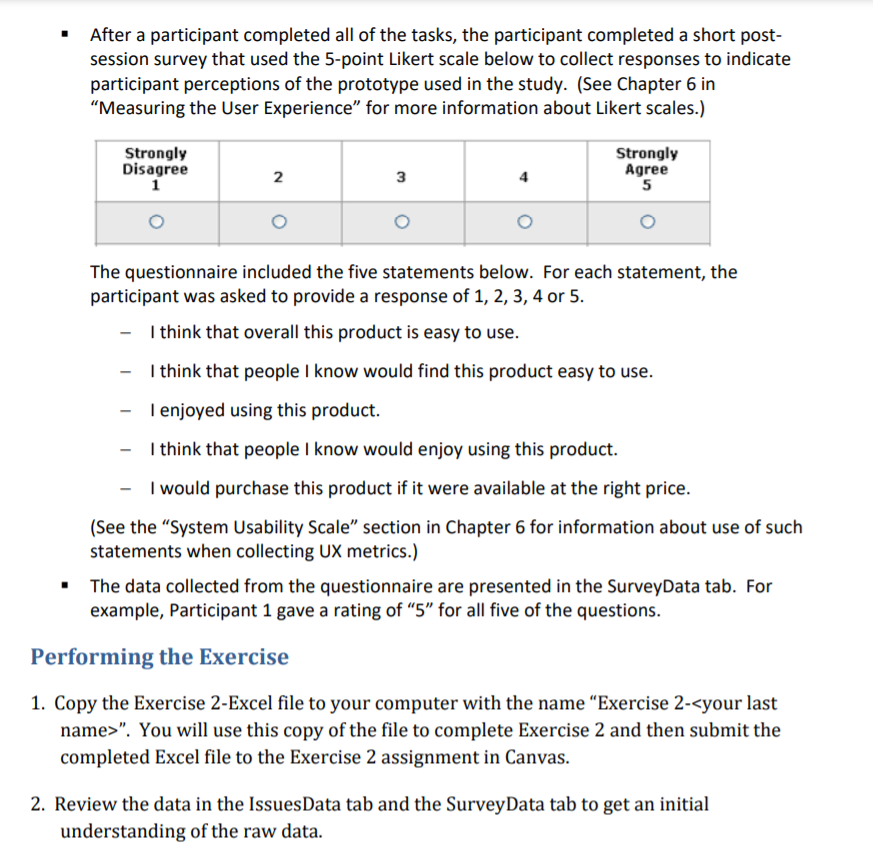
Exercise Z-Excel File Notes about this le: The file has four tabs Presentation, Analysis, SurveyData, and lssueData. The SurveyData and IssueData tabs contain the data that you will use for Exercise 2. You will not be changing the data. You will use the data from the SurveyData and IssueData tabs to create summary tables in the Analysis tab. You will use these summary tables to create charts and place the charts in the Presentation tab. For this study, 15 participants were asked to use a high-fidelity prototype of an e- commerce website to complete 8 different shopping tasks. While a participant was attempting to complete each task, an observer recorded if the participant encountered any issues. Each issue observed was assigned a unique number ie.g., 1 = Did not see checkout link, 2 = Confused by navigation choices, etc]. The specific issues are not included in the data instead the generic terms of "Issue 1," "Issue 2,\" etc. are used. {See Chapter 5 in \"Measuring the User Experience\" for more information about issues- based metrics.) The Issues data for the study are presented in two tables in the IssuesData tab. There were ten different issues observed during the study. The first table in the IssuesData tab shows the number of times that each participant encountered each issue during the study (i.e., for all of the tasks). For example, Participant 1 encountered Issue 1 once and encountered Issue a once, but did not encounter any other issues. These data support a summary of how many different issues were encountered and how many times each of these issues was encountered in the study. - The second table in the IssuesData tab shows the number of issues encountered by each participant In each of the tasks regardless of the type of issue. For example, Participant 1 encountered two issues in Task 1, but no issues in the other tasks. These data support a summary of how many issues were encountered during each task in the study. After a participant completed all of the tasks, the participant completed a short post- session surveyr that used the 5-point Likert scale below to collect responses to indicate participant perceptions of the prototype used in the study. (See Chapter 6 in \"Measuring the User Experience" for more information about Likert scales.) 3:33: I ' T Agree? 1 2 3 4| 5 l o o l o [ o [ o The questionnaire included the five statements below. For each statement, the participant was asked to provide a response of 1, 2, 3, 4 or 5. I think that overall this product is easy to use. I think that people I know would find this product easy to use. I enjoved using this product. I think that people I know would enjoy using this product. I would purchase this product if it were available at the right price. {See the "System Usability Scale" section in Chapter 6 for information about use of such statements when collecting UX metrics.) The data collected from the questionnaire are presented in the Survey-Data tab. For example, Participant 1 gave a rating of \"5\" for all five of the questions. Performing the Exercise 1. Copy the Exercise Z-Excel le to your computer with the name \"Exercise 2-
Step by Step Solution
There are 3 Steps involved in it

Get step-by-step solutions from verified subject matter experts