

Question: Problem 6-17A Inventory ratios LO7 Using the Indigo financial statements In Appendix III, calculate the following ratios for the year ended April 1, 2017 and
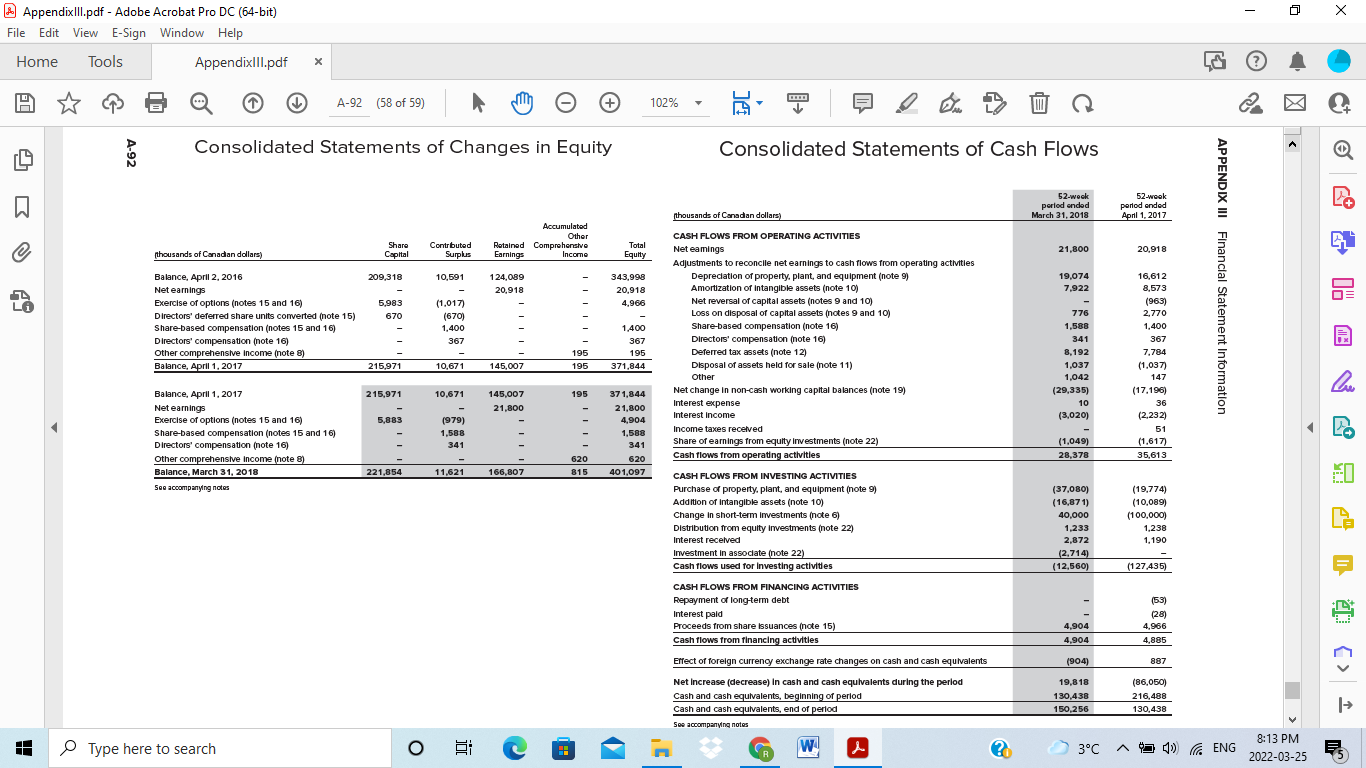
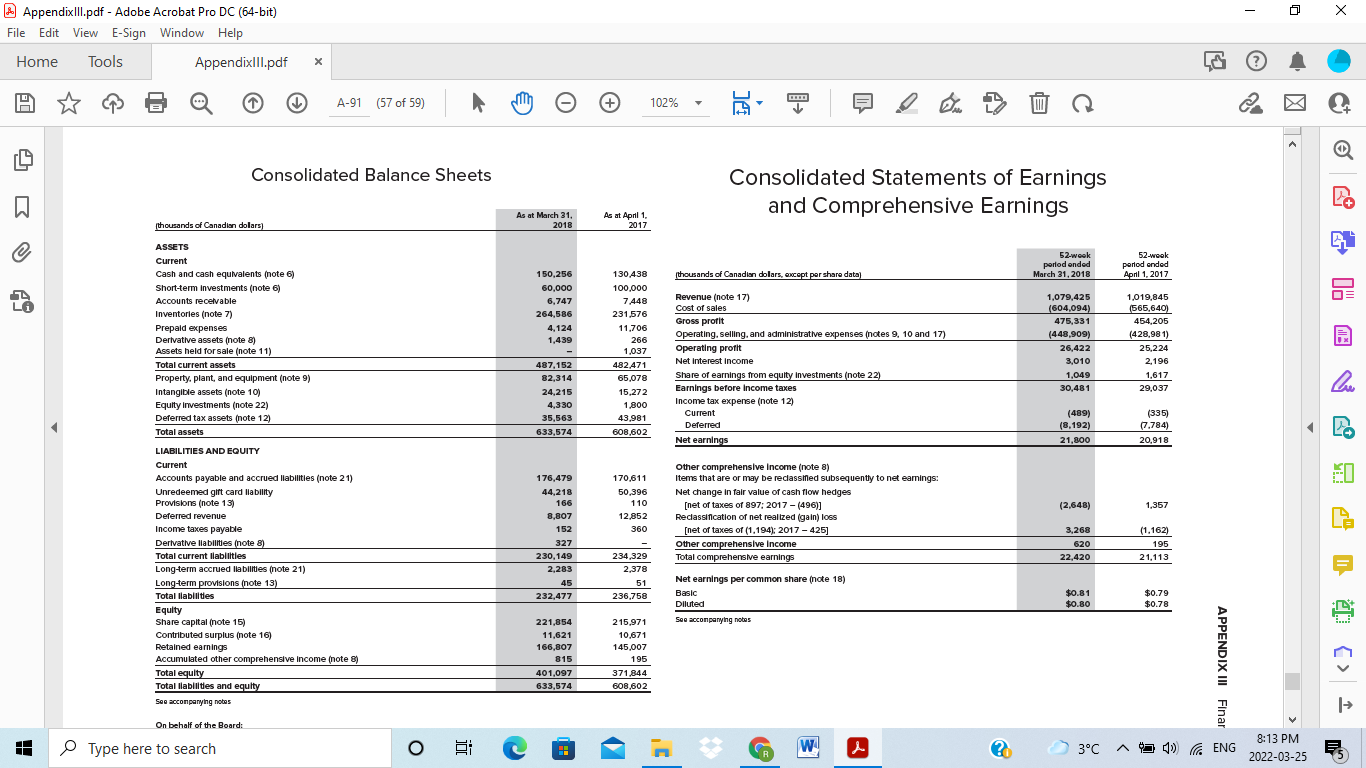
Problem 6-17A Inventory ratios LO7 Using the Indigo financial statements In Appendix III, calculate the following ratios for the year ended April 1, 2017 and March 31, 2018. Inventory for the year 2016 is 217,788,000. a. Inventory turnover ratio. (Round the final answers to two decimal places.) 2018 2017 Inventory turnover ratio 7.50 7.56 b. Days' sales In Inventory. (Round the final answers to the nearest whole days. Use 365 days a year.) 2018 Days' sales in inventory 40 days 48 days - 0 AppendixIII.pdf - Adobe Acrobat Pro DC (64-bit) File Edit View E-Sign Window Help Home Tools AppendixIII.pdf X va A-92 (58 of 59) 102% 7 1 2 A-92 Consolidated Statements of Changes in Equity Consolidated Statements of Cash Flows 52-wock period ended March 31, 2018 52-week period ended April 1, 2017 thousands of Canadian dollars) Share Capital Contbuted Surplus Accumulated Other Retained Comprehensive Earnings Income thousands of Canadan dollars) Total Equity 20,918 21,800 Balance, April 2, 2016 209,318 124,089 20.918 Net earnings es 5,983 670 10,591 - (1.017) (670) 1,400 367 343.990 20,918 4,966 - 1.400 APPENDIX III Financial Statement Information Exercise of options (notes 15 and 16) Directors' deferred share units converted (note 15) Share-based compensation (notes 15 and 16) Directors' compensation (note 16) Other comprehensive Income (note 8) Balance, April 1, 2017 , 1 - 195 195 367 195 371,844 215,971 10,671 145,007 19,074 7,922 - 776 1,588 341 8,192 1,037 1,042 (29,335) 10 (3,020) - (1,049) ) 28,378 16,612 8,573 (963) ( 2.770 1,400 367 7.784 (1.037) 147 (17,196) 36 (2.232) 51 (1,617) 35,613 lu SAB = 215,971 195 CASH FLOWS FROM OPERATING ACTIVITIES Net eamings Adjustments to reconcile net earnings to cash flows from operating activities Depreciation of property, plant, and equipment (note 9) Amortization of Intangible assets (note 10) Net reversal of capital assets (notes 9 and 10) Loss on disposal of capital assets (notes 9 and 10) Share-based compensation (note 16) Directors' compensation mote 16) Deferred tax assets (note 12) Disposal of assets held for sale (note 11) Other Net change in non-cash working capital balances (note 19) () Interest expense Interest income Income taxes received Share of earnings from equity Investments (note 22) Cash flows from operating activities CASH FLOWS FROM INVESTING ACTIVITIES Purchase of property, plant, and equipment (note 9) Addition of Intangible assets (note 10) Change in short-term investments (note 6) Distribution from equity Investments (note 22) Interest received Investment in associate (note 22) Cash flows used for Investing activities 145,007 21,800 Balance, April 1, 2017 Net earnings Exercise of options (notes 15 and 16) Share-based compensation (notes 15 and 16) Directors' compensation (note 16) Other comprehensive Income (note 8) Balance, March 31, 2018 See accompanying notes 5,883 10,671 - (979) 1,588 341 371,844 21,800 4,904 1,588 341 620 401,097 - - 620 81 221,854 11,621 166,807 (37,080) (16,871) 40,000 1,233 2,872 (2,714) (12,560) (19,774) (10,089) (100,000) 1.238 1,190 (127,435) CASH FLOWS FROM FINANCING ACTIVITIES Repayment of long-term debt Interest pald Proceeds from share issuances (note 15) Cash flows from financing activities 4.904 4,904 (53) (28) 4,966 4,885 (904) 887 Effect of foreign currency exchange rate changes on cash and cash equivalents Net Increase (decrease) In cash and cash equivalents during the period ( Cash and cash equivalents, beginning of period Cash and cash equivalents, end of period See accompanying notes wil ? 19,818 130,438 150,256 (86,050) 216,488 130,438 1 1 Type here to search j c a 3C A3 ) a ENG 8:13 PM 2022-03-25 - 0 AppendixIII.pdf - Adobe Acrobat Pro DC (64-bit) File Edit View E-Sign Window Help Home Tools Appendixlll.pdf LA A A-91 (57 of 59) O + 102% HT en 7 2 Consolidated Balance Sheets Consolidated Statements of Earnings and Comprehensive Earnings As at March 31, 2018 As at Apnl 1. 2017 (thousands of Canadian dolars) 52- week period ended March 31, 2018 52- week period ended April 1, 2017 (thousands of Canadian dolars, except per share data) , ) 130,438 100,000 7,448 es ASSETS Current Cash and cash equivalents (note 6) Short-term investments (note 6) Accounts receivable Inventories (note 7) Prepaid expenses Derivative assets (note 8) Assets held for sale (note 11) Total current assets Property, plant, and equipment (note 9) Intangible assets (note 10) Equity Investments (note 22) Deferred tax assets (note 12) Total assets 150,256 60,000 6,747 264,586 4,124 1,439 231576 11.706 266 1.037 482.471 65,078 15,272 1.800 43,981 608,602 Revenue (note 17) Cost of sales Gross profit Operating, seling, and administrative expenses (notes 9, 10 and 17) Operating profit Net Interest Income Share of earnings from equity investments (note 22) Earnings before Income taxes Income tax expense (note 12) Current Deferred Net earnings 1,079,425 (604.094) 475,331 (448,909) 26,422 3,010 1.049 30,481 1,019,845 (565,640) 454,205 (428,981) 25,224 2.196 1,617 29,037 487,152 82,314 24.215 4,330 35,563 633,574 lu (489) (8.192) (335) (7.784) 20,918 29 GP 21,800 170,611 50,396 110 12,852 360 (2,648) 1,357 Other comprehensive Income (note 8) Items that are or may be reclassified subsequently to net earings: Net change in fair value of cash flow hedges [net of taxes of 897: 2017-(496)] Reclassification of net realized (gain) loss [net of taxes of (1.194): 2017-425] Other comprehensive Income Total comprehensive earnings 176,479 44,218 166 8,807 152 327 230,149 2,283 45 232,477 3,268 620 22,420 (1.162) 195 21.113 LIABILITIES AND EQUITY Current Accounts payable and accrued liabilities (note 21) Unredeemed gift card liability Provisions (note 13) Deferred revenue Income taxes payable Derivative liabilities (note 8) Total current liabilities Long-term accrued liabilities (note 21) Long-term provisions (note 13) Total abilities Equity Share capital (note 15) Contributed surplus (note 16) Retained earnings Accumulated other comprehensive Income (note 8) Total equity Total liabilities and equity See accompanying notes 234 329 2,378 51 236,758 01 Net earnings per common share (note 18) Basic Diluted Sea accompanying notes $0.81 $0.80 $0.79 $0.78 221,854 11,621 166,807 815 401,097 633,574 215,971 10,671 145.007 195 371 844 608,602 APPENDIX III Finar z [> 1 On behalf of the Board: Type here to search j w c J' 3C 4 ENG 8:13 PM 2022-03-25 - 0 AppendixIII.pdf - Adobe Acrobat Pro DC (64-bit) File Edit View E-Sign Window Help Home Tools AppendixIII.pdf G A 1 A-87 (53 of 59) O 102% at and other comprehensive income Consolidated statements of financial position Note 2017 2016 Note 2017 2016 Years onded December 31 (milions except por share amounts Operating Revenues Service Equipment $ 432 1,471 As at December 31 millions) Assets Current assets Cash and temporary Investments, net Accounts receivable Income and other takes receivable Inventories Prepaid expenses Current derivative assets 6 $12.478 724 13,202 102 13,304 Revenues arising from contracts with customers Other operating income $12.000 725 12,725 74 12,799 7 1(p) $ 509 1.623 96 378 260 18 2.884 9 318 233 11 2,474 4th) es Operating Expenses Goods and services purchased Employee benefits expense Depreciation Amortization of Intangible assets 5.631 2.939 1,564 17 18 5.935 2,595 1,617 552 10,699 2.606 572 482 10,617 Non-current assets Property, plant and equipment, net , Intangible assets, net Goodwill.net Other long-term assets 17 18 18 20 11,368 10,658 4,217 421 26,664 $29,548 10,464 10,364 3,787 640 25,255 $27,729 2,182 520 1,662 426 1236 9 2.032 553 lu 10 1,479 Operating Income Financing costs Income Before Income Taxes Income taxes Net Income Other Comprehensive Income Items that may subsequently be reclassified to income Change in unrealized far value of derivatives designated as cash flow hedges Foreign currency translation adjustment arising from translating financial statements of foreign operations Change in unrealized far value of available for sale financial assets 11 22 23 19 Liabilities and Owners' Equity Current liabilities Short-term borrowings Accounts payable and accrued liabilities Income and other taxes payable Dividends payable Advance bilings and customer deposits Provisions Current maturities of long-term debt Current derivative liabilities (20) A Bm EF 5 5 (11) 13 $ 100 2,460 34 299 782 78 1,404 33 5,190 13 24 25 26 4th) $ 100 2.330 37 284 737 124 1,327 12 4,951 (15) Item never subsequently reclassified to Income Employee defined benefit plans re- measurements (172) (159) $ 1,320 (15) $ 1221 492 Comprehensive Income Net Income Attributable to Common Shares Nor-controlling Interests Non-current liabilities Provisions Long-term debt Other long-term liabilities Deferred Income taxes $ 1,460 19 $ 1,479 $ 1222 13 $ 1.236 25 26 27 10) 12,256 847 2.500 16,095 21,285 395 11,604 736 2.107 14,842 19,793 Comprehensive Income Attributable to Common Shares Norrcontrolling Interests $ 1.297 23 $ 1,320 $ 1206 15 $ 1221 Liabilities Owners' equity Common equity Non-controlling interests APPENDIX III Financial Statement Ir 28 8,221 42 8,263 $29,548 7.917 19 7,936 $27,729 12 Net Income Per Common Share Basic Diluted Total Weighted Average Common Shares Outstanding Basic $ 2.46 $ 2.46 $ 2.06 $ 2.06 29 Contingent Liabilities The accompanying notes are on thegral part of mose consolidated financial statements. Approved by the Directors | + 593 --- 592 --- H Type here to search O ini c wal d a 3C A3 ) a ENG 8:12 PM 2022-03-25
Step by Step Solution
There are 3 Steps involved in it
To calculate the inventory ratios for the years ended April 1 2017 and March 31 2018 we need the cos... View full answer

Get step-by-step solutions from verified subject matter experts