

Question: Exercises Read case study then answer the following questions Exercise 1 Process capability Indices Using the data given in Table 1, determine the process capability
Exercises Read case study then answer the following questions
Exercise 1 Process capability Indices
Using the data given in Table 1, determine the process capability indices for performance metric. Provide the appropriate interpretation for the process capability indices drawn, based on the available data.
'First Call Resolution'. The specification limits for the FCR are; LSL=75% and USL=100%.
'5 Day Resolution'. The specification limits for the 5DR are; LSL=90% and USL=100%.
Exercise 2
What kind of data is shown in Table 2? Which method would you use for measurement system analysis (MSA) to verify the repeatability and reproducibility of QA results? Conduct the appropriate MSA.
Determine the potential causes why CCS fails to meet First Call Resolution targets consistently.
Brainstorm and propose solutions for elimination of causes for failure to meet FCR targets.
Exercise 3
FMEA
Identify potential failure modes and their effects for the solutions proposed in Exercise 2 using learning on FMEA.
Introduction
First Wealth Bank had outsourced its customer interactive services operations to Customer Calling Services (CCS) about 5 years ago. First Wealth Bank guaranteed minimum volume of 300,000 calls per year with the rate of $4.50 USD. Over the last two years, the service performance of CCS has deteriorated to such an extent that First Wealth Bank is considering cancelling the contract. CCS has been collecting the data on the duration the representatives were available to answer the calls and the hold time. The data for the last few months is shown in Table 1. The performance measures that were of interest to First Wealth Bank were:
Provide first call resolution to at least 75% of calls
Resolve minimum 90% of inquiries within 5 days
Furthermore, First Wealth Bank was monitoring the data on number of people who were unable to get answers from CCS.
The Quality Assurance (QA) department conducts regular inspections of recorded conversations between the callers and representatives. A rating based on the scale of 1-5 is assigned to the calls based on friendliness, accuracy, and suitable advice given to the callers. The table below shows the description of ratings:
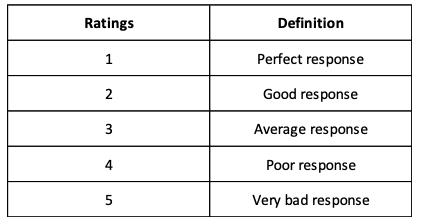
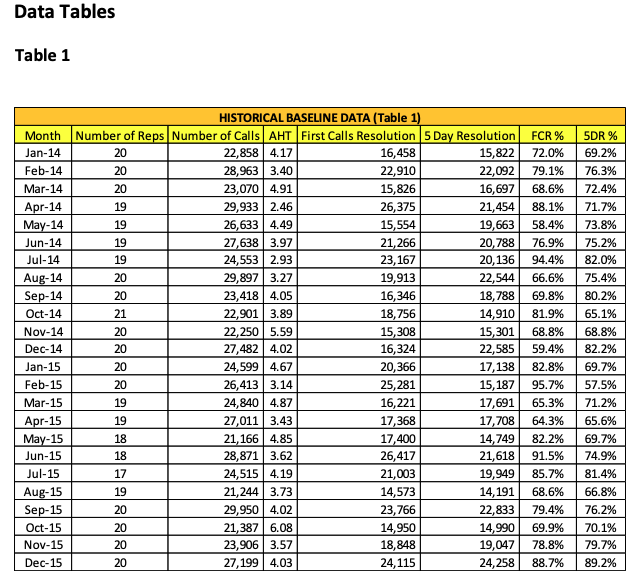
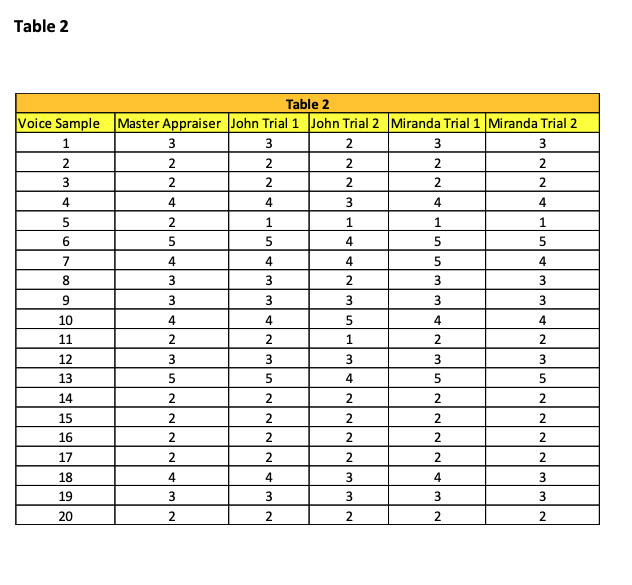
Ratings Definition 1 Perfect response Good response 3 Average response 4 Poor response 5 Very bad responseData Tables Table 1 HISTORICAL BASELINE DATA (Table 1) Month Number of Reps Number of Calls |AHT |First Calls Resolution |5 Day Resolution FCR % 5DR % Jan-14 20 22,858 4.17 16,458 15,822 72.0% 69.2% Feb-14 20 28,963 3.40 22,910 22,092 79.1% 76.3% Mar-14 20 23,070 4.91 15,826 16,697 68.6% 72.4% Apr-14 19 29,933 2.46 26,375 21,454 88.1% 71.7% May-14 19 26,633 4.49 15,554 19,663 58.4% 73.8% Jun-14 19 27,638 3.97 21,266 20,788 76.9% 75.2% Jul-14 19 24,553 2.93 23,167 20,136 94.4% 82.0% Aug-14 20 29,897 3.27 19,913 22,544 66.6% 75.4% Sep-14 20 23,418 4.05 16,346 18,788 69.8% 80.2% Oct-14 21 22,901 3.89 18,756 14,910 81.9% 65.1% Nov-14 20 22,250 5.59 15,308 15,301 68.8% 68.8% Dec-14 20 27,482 4.02 16,324 22,585 59.4% 82.2% Jan-15 20 24,599 4.67 20,366 17, 138 82.8% 69.7% Feb-15 20 26,413 3.14 25,281 15,187 95.7% 57.5% Mar-15 19 24,840 4.87 16,221 17,691 65.3% 71.2% Apr-15 19 27,011 3.43 17,368 17,708 64.3% 65.6% May-15 18 21,166 4.85 17,400 14,749 82.2% 69.7% Jun-15 18 28,871 3.62 26,417 21,618 91.5% 74.9% Jul-15 17 24,515 4.19 21,003 19,949 85.7% 81.4% Aug-15 19 21,244 3.73 14,573 14,191 68.6% 66.8% Sep-15 20 29,950 4.02 23,766 22,833 79.4% 76.2% Oct-15 20 21,387 6.08 14,950 14,990 69.9% 70.1% Nov-15 20 23,906 3.57 18,848 19,047 78.8% 79.7% Dec-15 20 27,199 4.03 24,115 24,258 88.7% 89.2%Table 2 Voice Sample 1 3 4 JAN D DO YOU A W N 10 12 N W A N N N N U W N A W W A UI N 13 N W W N N N N U W N A W W AUTH 14 15 16 17 18 19 20
Step by Step Solution
There are 3 Steps involved in it

Get step-by-step solutions from verified subject matter experts