

Question: Exercise 1 Process capability Indices Using the data given in Table 1, determine the process capability indices for performance metric. Provide the appropriate interpretation for
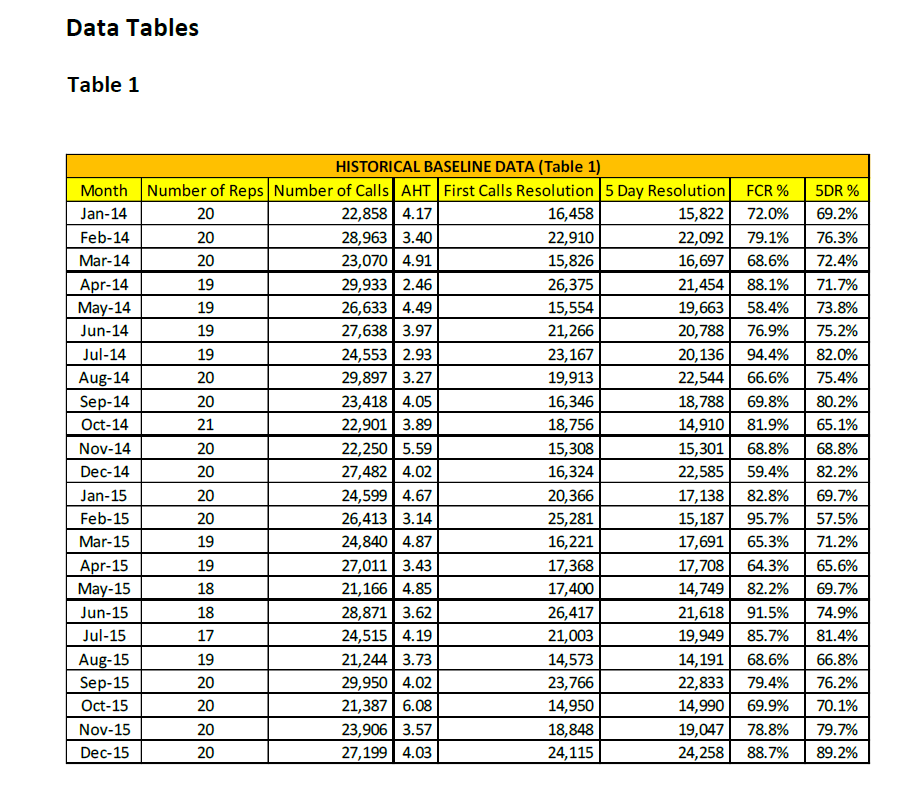
Exercise 1 Process capability Indices Using the data given in Table 1, determine the process capability indices for performance metric. Provide the appropriate interpretation for the process capability indices drawn, based on the available data. A.First Call Resolution. The specification limits for the FCR are; LSL=75% andUSL=100%. B.5 Day Resolution. The specification limits for the 5DR are; LSL=90% andUSL=100%.
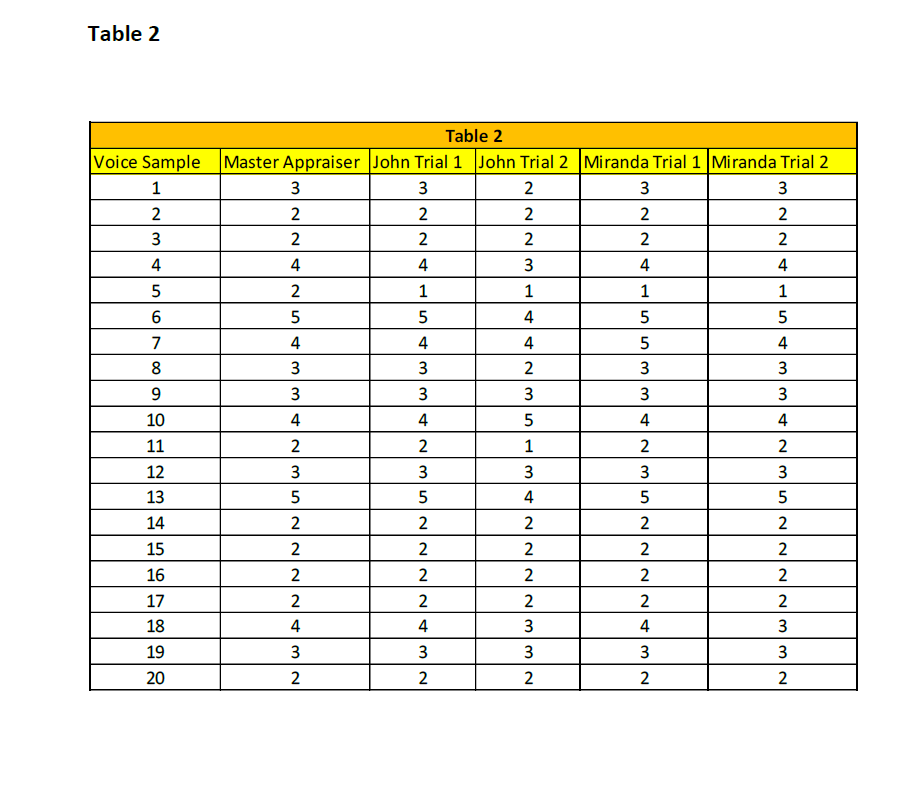
Exercise 2 A.What kind of data is shown in Table 2? Which method would you use formeasurement system analysis (MSA) to verify the repeatability andreproducibility of QA results? Conduct the appropriate MSA. B.Determine the potential causes why CCS fails to meet First Call Resolutiontargets consistently. C.Brainstorm and propose solutions for elimination of causes for failure to meetFCR targets.
Exercise 3 FMEA Identify potential failure modes and their effects for the solutions proposed in Exercise 2 using learning on FMEA.
Data Tables Table 1 19 20 HISTORICAL BASELINE DATA (Table 1) Month Number of Reps Number of Calls AHT First Calls Resolution 5 Day Resolution Jan-14 20 22,858 4.17 16,458 15,822 Feb-14 20 28,963 3.40 22,910 22,092 Mar-14 20 23,070 4.91 15,826 16,697 Apr-14 19 29,933 2.46 26,375 21,454 May-14 19 26,633 4.49 15,554 19,663 Jun-14 27,638 3.97 21,266 20,788 Jul-14 19 24,553 2.93 23,167 20,136 Aug-14 20 29,897 3.27 19,913 22,544 Sep-14 20 23,418 4.05 16,346 18,788 Oct-14 21 22,901 3.89 18,756 14,910 Nov-14 22,250 5.59 15,308 15,301 Dec-14 20 27,482 4.02 16,324 22,585 Jan-15 20 24,599 4.67 20,366 17,138 Feb-15 20 26,413 3.14 25,281 15,187 Mar-15 19 24,840 4.87 16,221 17,691 Apr-15 19 27,011 3.43 17,368 17,708 May-15 18 21,166 4.85 17,400 14,749 Jun-15 18 28,871 3.62 26,417 21,618 Jul-15 17 24,515 4.19 21,003 19,949 Aug-15 19 21,244 3.73 14,573 14, 191 Sep-15 29,950 4.02 23,766 22,833 Oct-15 20 21,3876.08 14,950 14,990 Nov-15 20 23,906 3.57 18,848 19,047 Dec-15 20 27,1994.03 24,115 24,258 FCR % 72.0% 79.1% 68.6% 88.1% 58.4% 76.9% 94.4% 66.6% 69.8% 81.9% 68.8% 59.4% 82.8% 95.7% 65.3% 64.3% 82.2% 91.5% 85.7% 68.6% 79.4% 69.9% 78.8% 88.7% 5DR % 69.2% 76.3% 72.4% 71.7% 73.8% 75.2% 82.0% 75.4% 80.2% 65.1% 68.8% 82.2% 69.7% 57.5% 71.2% 65.6% 69.7% 74.9% 81.4% 66.8% 76.2% 70.1% 79.7% 89.2% 20 alalala Table 2 NN N NN N 5 4 5 ww | 2. 3 5 w w Table 2 Voice Sample Master Appraiser John Trial 1 John Trial 2 Miranda Trial 1 Miranda Trial 2 1 3 3 2 3 3 2 2 2 2 2 3 2 2 2 2 4 4 4 3 4 4 5 2 1 1 1 1 6 5 5 4 5 5 7 4 4 4 4 8 3 3 3 3 9 3 3 3 3 10 4 4 4 4 11 2 2 1 2 12 3 3 3 3 5 5 4 5 14 2 2 2 2 15 2 2 2 2 16 2 2 2 2 2 2 2 18 4 4 4 3 19 3 3 3 3 3 20 2 2 2 2 2 13 mt NNN NUN NNNW AN NNNN 17 2. WN NW WNN 3 Nw Nw NStep by Step Solution
There are 3 Steps involved in it

Get step-by-step solutions from verified subject matter experts