

Question: Exhibit 1 graphically presents the average cash conversion cycle and operating cycle by industry over the 2012 through 2015 period. Exhibit 2 contrasts the CCC
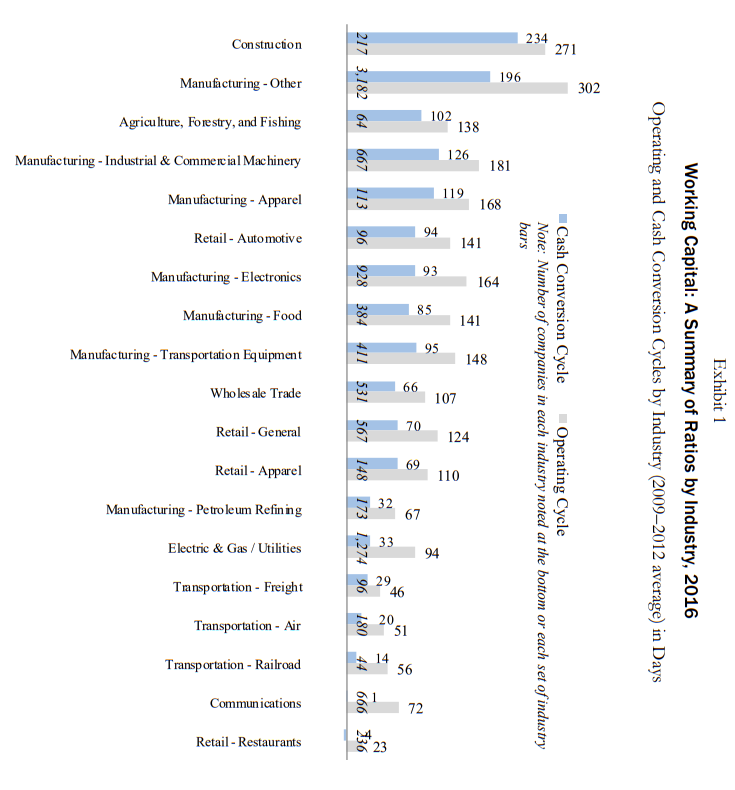
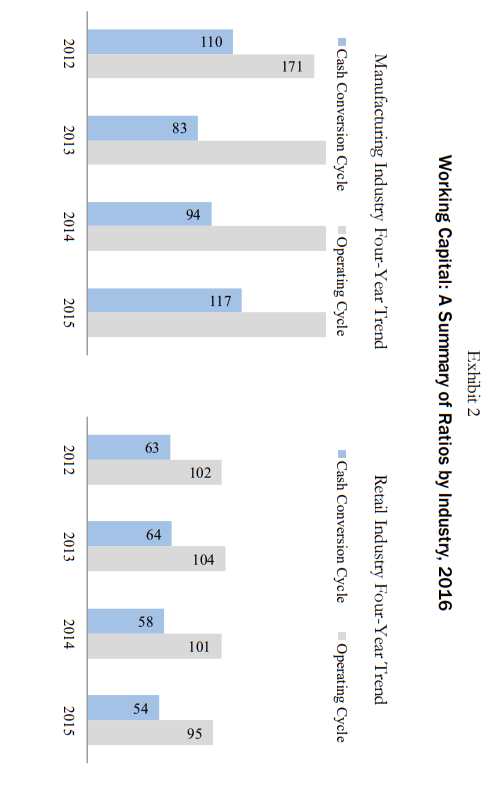
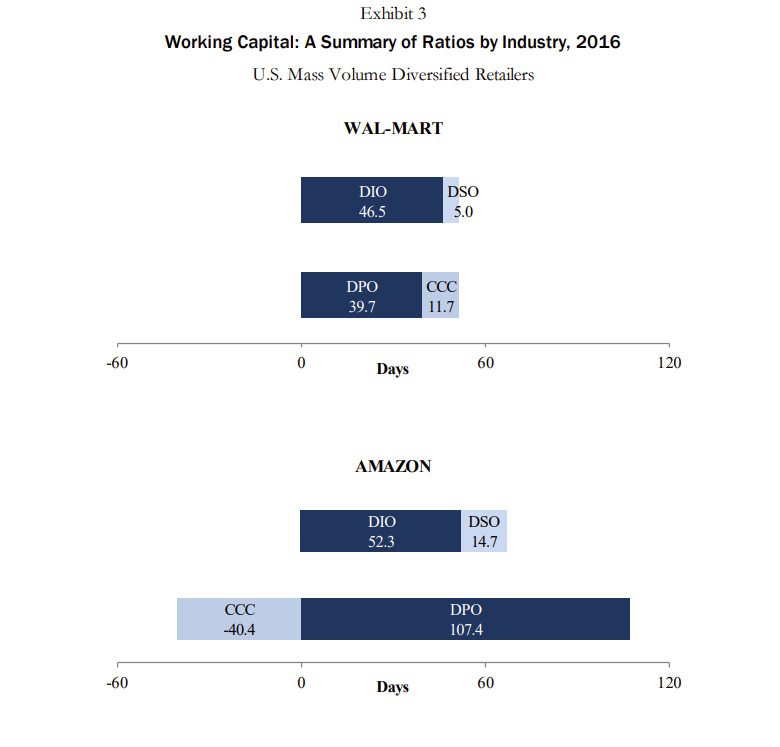
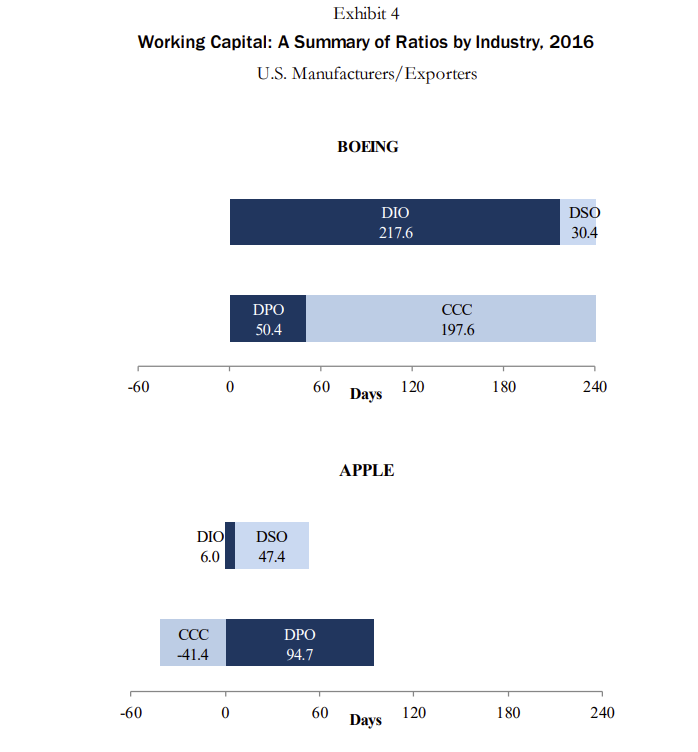
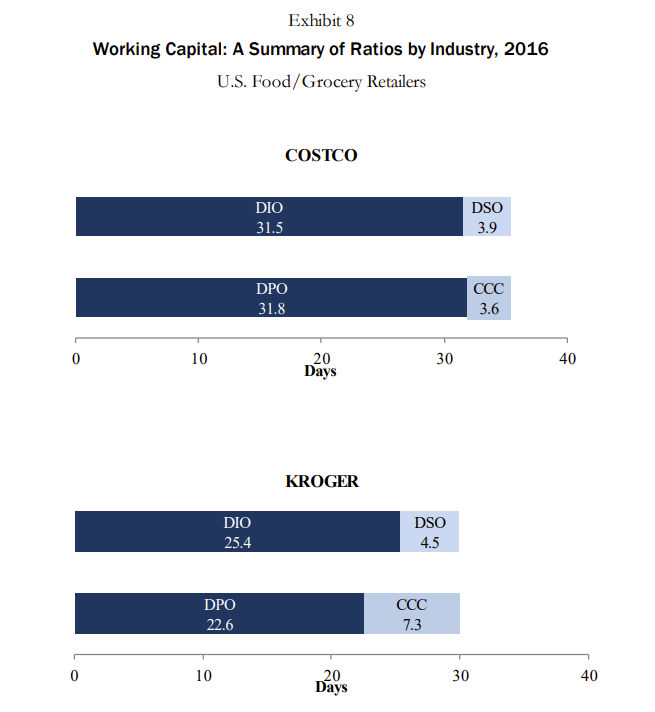
Exhibit 1 graphically presents the average cash conversion cycle and operating cycle by industry over the 2012 through 2015 period. Exhibit 2 contrasts the CCC and operating cycle of manufacturing and retail companies. Exhibits 3 through 8 provide examples of well-known companies within several different industries and present the CCC, DIO, DSO, and DPO for those companies. Spend some time reflecting on your knowledge of the industries and companies presented in Exhibits 1 through 8.
Can you craft an intuitive story around the working capital ratios that are presented in each exhibit?
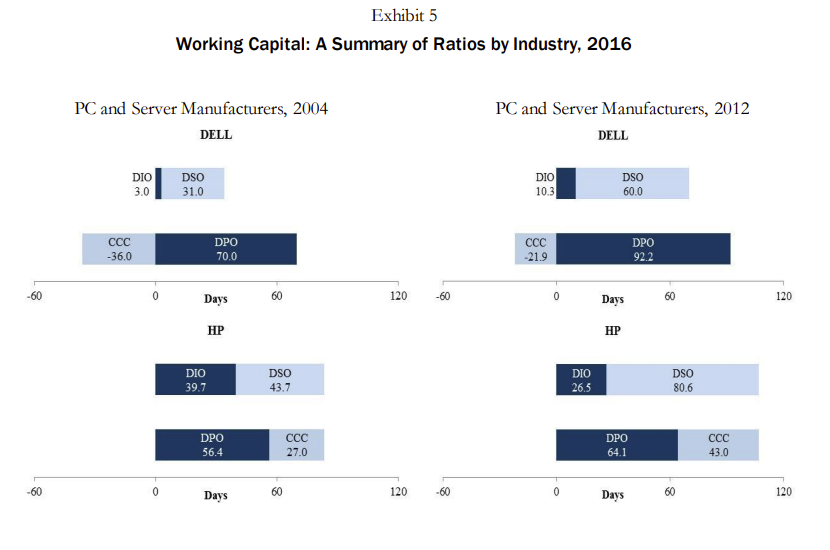
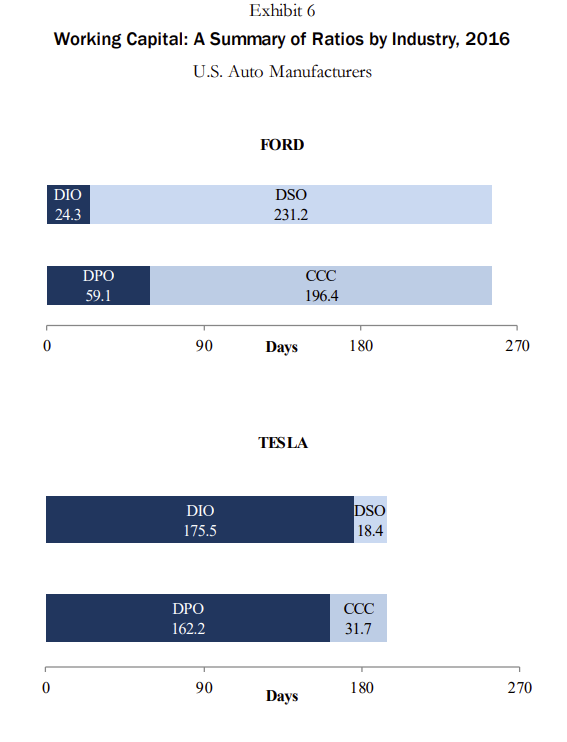
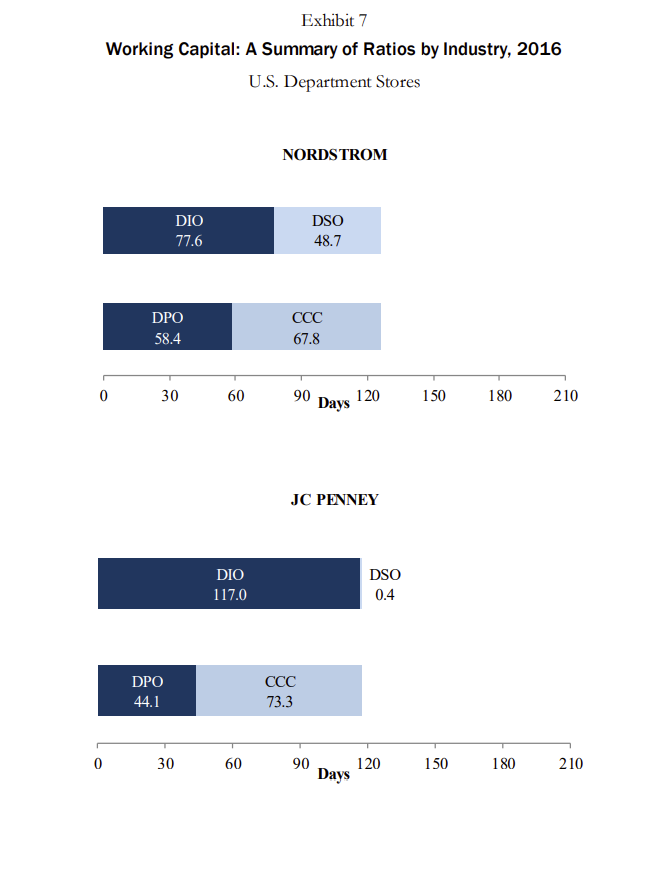
Working Capital: A Summary of Ratios by Industry, 2016 Manufacturing Industry Four-Year Trend Retail Industry Fous Working Capital: A Summary of Ratios by Industry, 2016 Exhibit 4 Working Canital: Smmarv of Ratios hv Indstrv. 2016 Working Capital: A Summary of Ratios by Industry, 2016 Exhibit 6 Working Capital: A Summary of Ratios by Industry, 2016 U.S. Auto Manufacturers FORD TESLA \begin{tabular}{cc} \hline DIO & DSO \\ 175.5 & 18.4 \\ \hline \end{tabular} \begin{tabular}{|ll} \hline DPO & CCC \\ 162.2 & 31.7 \\ \hline \end{tabular} \begin{tabular}{lcccc} \hline 0 & 90 & Days & 180 & 270 \end{tabular} Exhibit 7 Working Capital: A Summary of Ratios by Industry, 2016 U.S. Department Stores NORDSTROM \begin{tabular}{|c|c|} \hline DIO & DSO \\ 77.6 & 48.7 \\ \hline & \\ \hline DPO & CCC \\ 58.4 & 67.8 \\ \hline \end{tabular} JC PENNEY DIO117.0DSO0.4 \begin{tabular}{llllllll} \hline 0 & 30 & 60 & 90 & & 1 & & \\ & & 120 & 150 & 180 & 210 \end{tabular} Fxhihit 8 Working Capital: A Summary of Ratios by Industry, 2016 Manufacturing Industry Four-Year Trend Retail Industry Fous Working Capital: A Summary of Ratios by Industry, 2016 Exhibit 4 Working Canital: Smmarv of Ratios hv Indstrv. 2016 Working Capital: A Summary of Ratios by Industry, 2016 Exhibit 6 Working Capital: A Summary of Ratios by Industry, 2016 U.S. Auto Manufacturers FORD TESLA \begin{tabular}{cc} \hline DIO & DSO \\ 175.5 & 18.4 \\ \hline \end{tabular} \begin{tabular}{|ll} \hline DPO & CCC \\ 162.2 & 31.7 \\ \hline \end{tabular} \begin{tabular}{lcccc} \hline 0 & 90 & Days & 180 & 270 \end{tabular} Exhibit 7 Working Capital: A Summary of Ratios by Industry, 2016 U.S. Department Stores NORDSTROM \begin{tabular}{|c|c|} \hline DIO & DSO \\ 77.6 & 48.7 \\ \hline & \\ \hline DPO & CCC \\ 58.4 & 67.8 \\ \hline \end{tabular} JC PENNEY DIO117.0DSO0.4 \begin{tabular}{llllllll} \hline 0 & 30 & 60 & 90 & & 1 & & \\ & & 120 & 150 & 180 & 210 \end{tabular} Fxhihit 8
Step by Step Solution
There are 3 Steps involved in it

Get step-by-step solutions from verified subject matter experts