

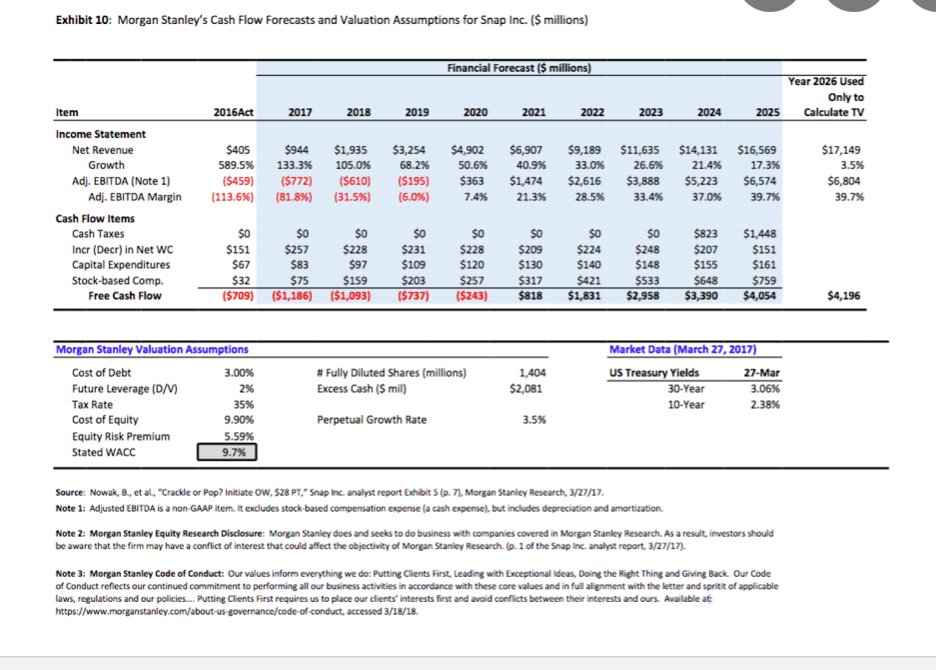
Exhibit 10: Morgan Stanley's Cash Flow Forecasts and Valuation Assumptions for Snap Inc. ($ millions) Item...
Fantastic news! We've Found the answer you've been seeking!
Question:
Expert Answer:
Free Cash Flow FCF Forecast and Snaps 2020 Revenue Forecast Growth Rates in FCF Forecast for Revenue The FCF forecast assumes varying growth rates for ... View the full answer

Related Book For 

Financial Reporting Financial Statement Analysis and Valuation a strategic perspective
ISBN: 978-1285190907
8th edition
Authors: James M. Wahlen, Stephen P. Baginski, Mark Bradshaw
Posted Date:
