

Question: The data in Table 1 represent the first exam score of 10 students enrolled in Introductory Statistics. Treat the 10 students as a population. (a)
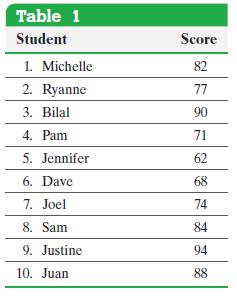
The data in Table 1 represent the first exam score of 10 students enrolled in Introductory Statistics. Treat the 10 students as a population.
(a) Compute the population mean.
(b) Find a simple random sample of size n = 4 students.
(c) Compute the sample mean of the sample found in part (b).
Approach
(a) To compute the population mean, add all the data values (test scores) and divide by the number of individuals in the population.
(b) We can use Table I in Appendix A, a calculator with a random-number generator, or computer software to obtain simple random samples. We will use a TI-84 Plus C graphing calculator.
(c) Find the sample mean by adding the data values corresponding to the individuals in the sample and then dividing by n = 4, the sample size.
Data from Appendix A
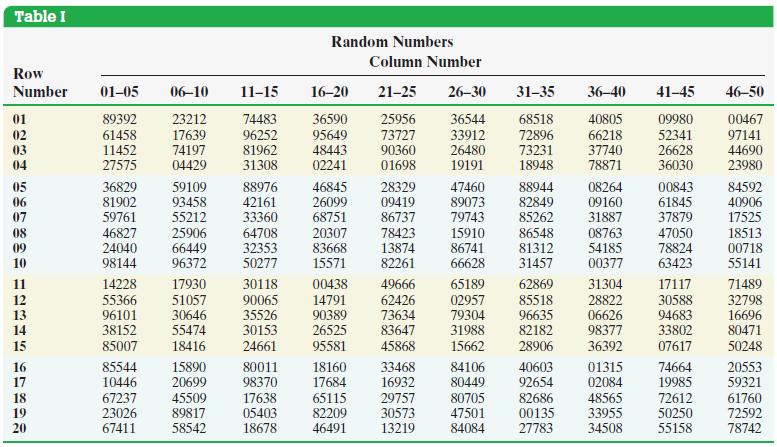
Table 1 Student Score 1. Michelle 82 2. Ryanne 77 3. Bilal 90 4. Pam 71 5. Jennifer 62 6. Dave 68 7. Joel 74 8. Sam 84 9. Justine 94 10. Juan 88
Step by Step Solution
3.49 Rating (152 Votes )
There are 3 Steps involved in it

Get step-by-step solutions from verified subject matter experts