

Question: Exhibit 10-1 Life Expectancy Tables, All Races, 2012 This table helps insurance companies determine insurance premiums. Use the table to find the average number of
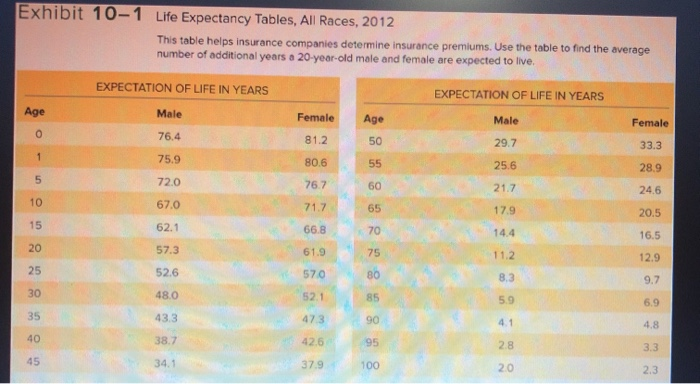
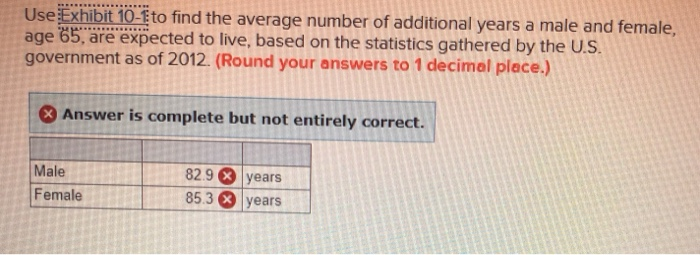
Exhibit 10-1 Life Expectancy Tables, All Races, 2012 This table helps insurance companies determine insurance premiums. Use the table to find the average number of additional years a 20-year-old male and female are expected to live. EXPECTATION OF LIFE IN YEARS Female Age Female Male 76.4 75.9 720 67.0 62.1 57.3 52.6 81.2 806 767 17 66. 8 619 50 55 60 65 70 78 EXPECTATION OF LIFE IN YEARS Male 29.7 256 217 179 14.4 112 33.3 28.9 24,6 20.5 16.5 12.9. 48.0 43.3 38.7 426 34.1 379
Step by Step Solution
There are 3 Steps involved in it
1 Expert Approved Answer
Step: 1 Unlock

Question Has Been Solved by an Expert!
Get step-by-step solutions from verified subject matter experts
Step: 2 Unlock
Step: 3 Unlock