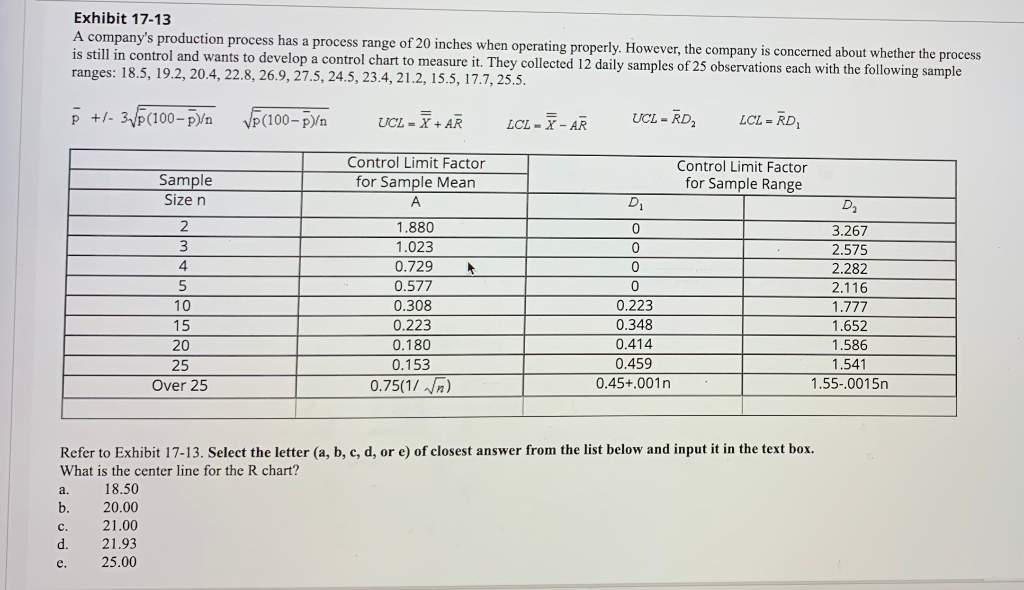
Question: Exhibit 17-13 A company's production process has a process range of 20 inches when operating properly. However, the company is concerned about whether the process

Exhibit 17-13 A company's production process hasExhibit 17-13 A company's production process has

Exhibit 17-13 A company's production process has a process range of 20 inches when operating properly. However, the company is concerned about whether the process is still in control and wants to develop a control chart to measure it. They collected 12 daily samples of 25 observations each with the following sample ranges: 18.5, 19.2, 20.4, 22.8, 26.9, 27.5, 24.5, 23.4, 21.2, 15.5, 17.7, 25.5. P +/- 310(100-p) VP(100-)'n UCL - +AR LCL --AR UCL - RD LCL - RD Sample Size n Control Limit Factor for Sample Mean A Control Limit Factor for Sample Range D D 2 3 4 5 10 15 20 25 Over 25 1.880 1.023 0.729 0.577 0.308 0.223 0.180 0.153 0.75(11 n) 0 0 0 0 0.223 0.348 0.414 0.459 0.45+.001n 3.267 2.575 2.282 2.116 1.777 1.652 1.586 1.541 1.55-.0015n Refer to Exhibit 17-13. Select the letter (a, b, c, d, or e) of closest answer from the list below and input it in the text box. What is the center line for the R chart? a. 18.50 b. 20.00 c. 21.00 d. 21.93 e. 25.00 a. Refer to Exhibit 17-13. Select the letter (a, b, c, d, or e) of closest answer from the list below and input it in the text box. What are the upper and lower control limits respectively for the R chart? 30.82; 9.18 b. 38.46; 1.54 21.54; 18.46 d. 40.00; 0.00 24.62; 15.38 c. e

Step by Step Solution

There are 3 Steps involved in it

1 Expert Approved Answer
Step: 1 Unlock blur-text-image
Question Has Been Solved by an Expert!

Get step-by-step solutions from verified subject matter experts

Step: 2 Unlock
Step: 3 Unlock

Students Have Also Explored These Related General Management Questions!