

Question: Exhibits 1, 2, and 4 in the Case Study provide performance information for Procter & Gamble for the years 2015 through 2017. For each item
*** 2015 - 2017 ***
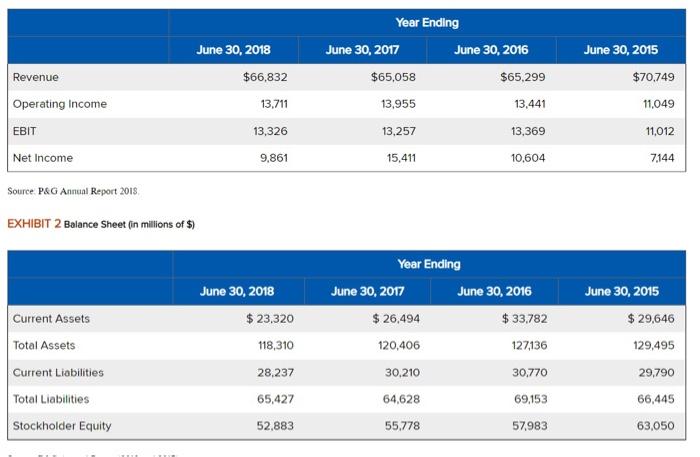
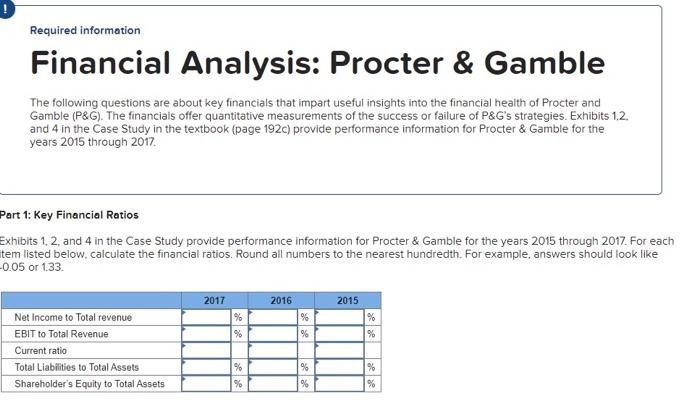
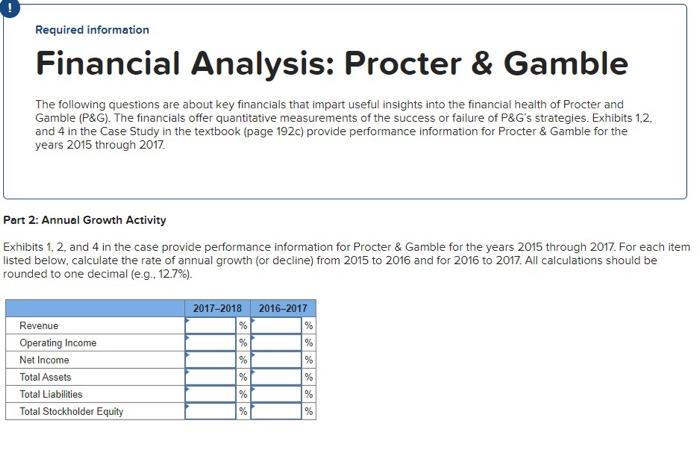
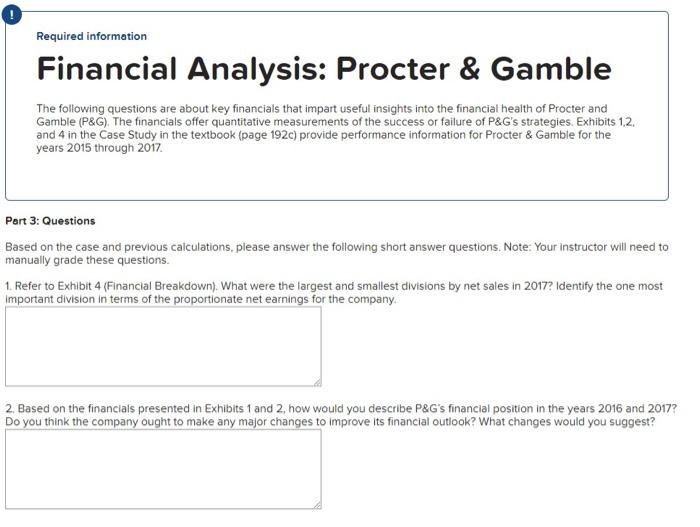
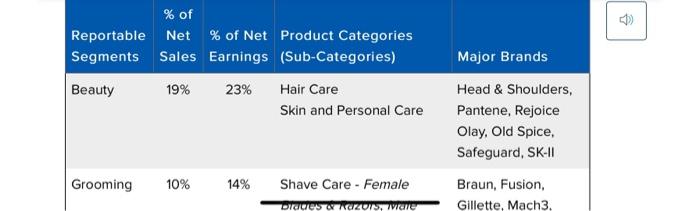
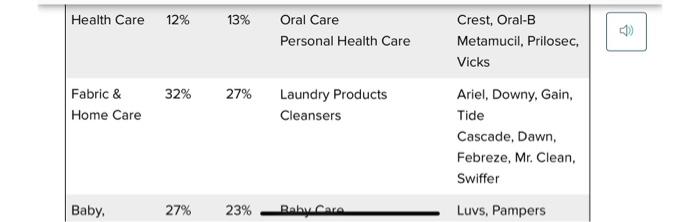
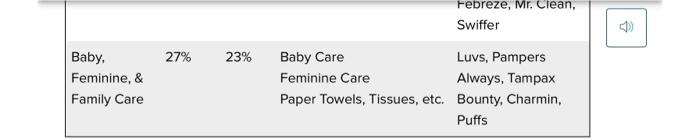
Year Ending June 30, 2017 June 30, 2016 $65,058 $65,299 13,955 13,441 June 30, 2018 $66,832 13,711 June 30, 2015 $70749 Revenue 11,049 Operating Income EBIT 13,326 13,257 13,369 11,012 Net Income 9.861 15,411 10,604 7.144 Source P&G Annual Report 2013 EXHIBIT 2 Balance Sheet (in Millions of 5) June 30, 2018 $ 23,320 118,310 Year Ending June 30, 2017 June 30, 2016 $ 26,494 $33,782 120,406 127136 30,210 30,770 June 30, 2015 $ 29,646 129,495 Current Assets Total Assets Current Liabilities Total Liabilities Stockholder Equity 28,237 29,790 65,427 64,628 69,153 66,445 52.883 55,778 57,983 63,050 Required information Financial Analysis: Procter & Gamble The following questions are about key financials that impart useful insights into the financial health of Procter and Gamble (P&G). The financials offer quantitative measurements of the success or failure of P&G's strategies. Exhibits 1.2. and 4 in the Case Study in the textbook (page 192c) provide performance information for Procter & Gamble for the years 2015 through 2017 Part 1: Key Financial Ratios Exhibits 1.2 and 4 in the Case Study provide performance information for Procter & Gamble for the years 2015 through 2017. For each tem listed below. calculate the financial ratios. Round all numbers to the nearest hundredth. For example, answers should look like -0.05 or 1.33 2016 2017 % % % 2015 % % % Net Income to Total revenue EBIT to Total Revenue Current ratio Total Liabilities to Total Assets Shareholder's Equity to Total Assets % % % % % % Required information Financial Analysis: Procter & Gamble The following questions are about key financials that impart useful insights into the financial health of Procter and Gamble (P&G). The financials offer quantitative measurements of the success or failure of P&G's strategies. Exhibits 1.2. and 4 in the Case Study in the textbook (page 192C) provide performance information for Procter & Gamble for the years 2015 through 2017. Part 2: Annual Growth Activity Exhibits 1, 2, and 4 in the case provide performance information for Procter & Gamble for the years 2015 through 2017. For each item listed below, calculate the rate of annual growth (or decline) from 2015 to 2016 and for 2016 to 2017. All calculations should be rounded to one decimal (e.g., 12.7%). Revenue Operating Income Net Income Total Assets Total Liabilities Total Stockholder Equity 2017-2018 2016-2017 % % % % % % % % sellele % % Required information Financial Analysis: Procter & Gamble The following questions are about key financials that impart useful insights into the financial health of Procter and Gamble (P&G). The financials offer quantitative measurements of the success or failure of P&G's strategies. Exhibits 1.2. and 4 in the Case Study in the textbook (page 192C) provide performance information for Procter & Gamble for the years 2015 through 2017 Part 3: Questions Based on the case and previous calculations, please answer the following short answer questions. Note: Your Instructor will need to manually grade these questions. 1. Refer to Exhibit 4 (Financial Breakdown). What were the largest and smallest divisions by net sales in 2017? Identify the one most Important division in terms of the proportionate net earnings for the company 2. Based on the financials presented in Exhibits 1 and 2 how would you describe P&G's financial position in the years 2016 and 2017? Do you think the company ought to make any major changes to improve its financial outlook? What changes would you suggest? % of Reportable Net % of Net Product Categories Segments Sales Earnings (Sub-Categories) Beauty 19% Hair Care Skin and Personal Care 23% Major Brands Head & Shoulders, Pantene, Rejoice Olay, Old Spice, Safeguard, SK-II Grooming 10% 14% Shave Care - Female Braun, Fusion, Gillette, Mach3 DIUCCISO UZOIS, are Health Care 12% 13% Oral Care Personal Health Care Crest, Oral-B Metamucil, Prilosec, Vicks 32% 27% Fabric & Home Care Laundry Products Cleansers Ariel, Downy. Gain, Tide Cascade, Dawn, Febreze, Mr. Clean Swiffer Baby. 27% 23% Rahu Luvs, Pampers Febreze, Mr. Clean, Swiffer 27% 23% Baby, Feminine, & Family Care Baby Care Luvs, Pampers Feminine Care Always, Tampax Paper Towels, Tissues, etc. Bounty, Charmin, Puffs
Step by Step Solution
There are 3 Steps involved in it

Get step-by-step solutions from verified subject matter experts