

Exhibits 14-11 and 14-12 on present the statements of financial position and activities for a nonprofit, the
Question:
Exhibits 14-11 and 14-12 on present the statements of financial position and activities for a nonprofit, the Code 4 Change. Please calculate the financial ratios listed in problem 14-11 using Excel. In a single workbook, present and interpret these figures. Summarize them in a single table showing both 2017 and 2016, and then for each, define the ratio and discuss what information it conveys in this context.
Exhibit 14-11:
Present the statements of financial position and of activities for Code 4 Change, a fictional organization that provides training in computer programming to the unemployed. For both
2017 and 2016, calculate:
a. common size ratios for the statements of financial position and
statements of activities
b. the current ratio
c. days of cash on hand
d. the debt to equity ratio
e. the total margin
f. the program services ratio
How do you assess Code 4 Change’s overall financial position and
performance? Why? In your assessment, make reference to each ratio you
calculated.
14-11:
14-12:
Please fill out the grey shaded cells:
Excel Cells same as pictures above:
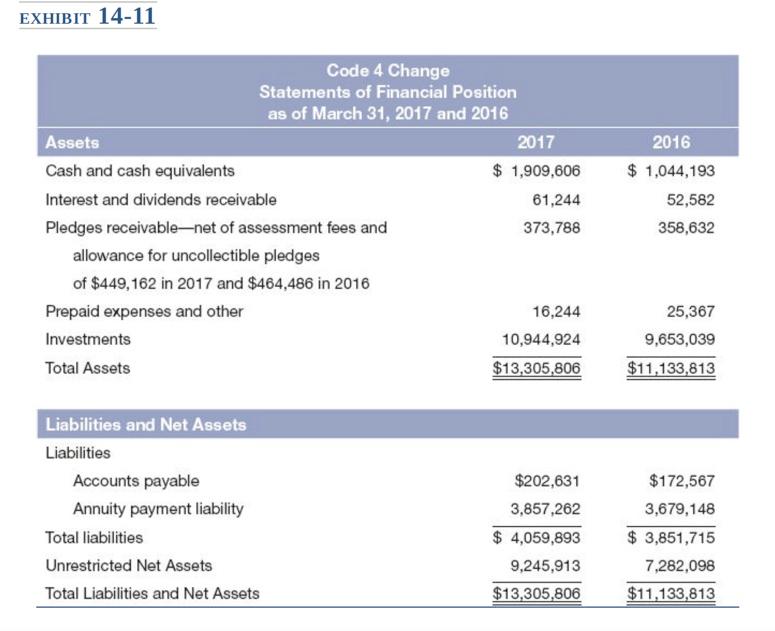
| CODE 4 CHANGE | ||||
| Statements of Financial Position | ||||
| Common Size Ratios | ||||
| December 30, 2017 | December 30, 2016 | |||
| % | $ | % | $ | |
| ASSETS | ||||
| CASH AND CASH EQUIVALENTS | 1,909,606 | 1,044,193 | ||
| INTEREST AND DIVIDENDS RECEIVABLE | 61,244 | 52,582 | ||
| CAMPAIGNS’ PLEDGES RECEIVABLE | 373,788 | 358,632 | ||
| PREPAID EXPENSES AND OTHER | 16,244 | 25,367 | ||
| INVESTMENTS | 10,944,924 | 9,653,039 | ||
| TOTAL | 0.00% | 13,305,806 | 0.00% | 11,133,813 |
| LIABILITIES AND NET ASSETS | ||||
| LIABILITIES: | ||||
| Accounts payable — DAV | 201,721 | 171,550 | ||
| Accounts payable — other | 910 | 1,017 | ||
| Annuity payment liability | 3,857,262 | 3,679,148 | ||
| Total liabilities | 4,059,893 | 3,851,715 | ||
| UNRESTRICTED NET ASSETS | 9,245,913 | 7,282,098 | ||
| TOTAL LIABLITIES and NET ASSETS | 0.00% | 13,305,806 | 0.00% | 11,133,813 |
| NOTE: the denominator needs to be the same for all numbers; in this case, total assets | ||||
| Interpretation: |
| |||
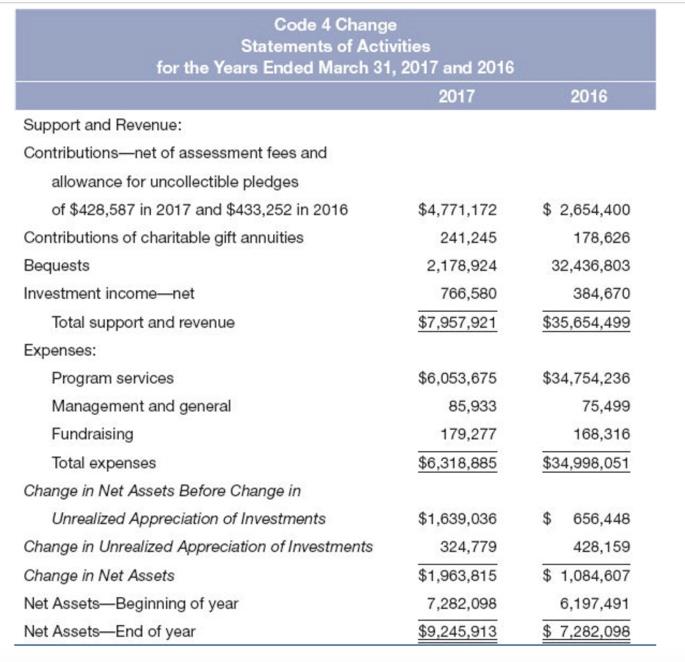
| PART A continued | ||||||
| CODE 4 CHANGE | ||||||
| Statements ofActivities | ||||||
| Common Size Ratios | ||||||
| December 30, 2017 | December 30, 2016 | |||||
| % | $ | % | $ | |||
| SUPPORT AND REVENUE: | ||||||
| Contributions | 4,771,172 | 2,654,400 | ||||
| Contributions of charitable gift annuities | 241,245 | 178,626 | ||||
| Bequests | 2,178,924 | 32,436,803 | ||||
| Investment income — net | 766,580 | 384,670 | ||||
| Total support and revenue | 0.00% | 7,957,921 | 0.00% | 35,654,499 | ||
| EXPENSES: | ||||||
| Program services | 6,053,675 | 34,754,236 | ||||
| Management and general | 85,933 | 75,499 | ||||
| Fundraising | 179,277 | 168,316 | ||||
| Total expenses | 6,318,885 | 34,998,051 | ||||
| CHANGE IN NET ASSETS BEFORE CHANGE IN UNREALIZED APPRECIATION OF INVESTMENTS | 1,639,036 | 656,448 | ||||
| CHANGE IN UNREALIZED APPRECIATION OF INVESTMENTS | 324,779 | 428,159 | ||||
| CHANGE IN NET ASSETS | 1,963,815 | 1,084,607 | ||||
| NET ASSETS — Beginning of year | 7,282,098 | 6,197,491 | ||||
| NET ASSETS — End of year | 9,245,913 | 7,282,098 | ||||
| NOTE: the denominator needs to be the same for all numbers; in this case, total support and revenue | ||||||
| Interpretation: | | |||||
Expert Answer:
b Current ratio current assetscurrent liabilities 2017 2016 Current assets Cash 190960600 104419300 ... View the full answer


Financial Accounting and Reporting
ISBN: 978-0273744443
14th Edition
Authors: Barry Elliott, Jamie Elliott
