

Question: (Expected return, standard deviation, and capital asset pricing model) The following are the end-of-month prices for both the Standard & Poor's 500 index and Nike's
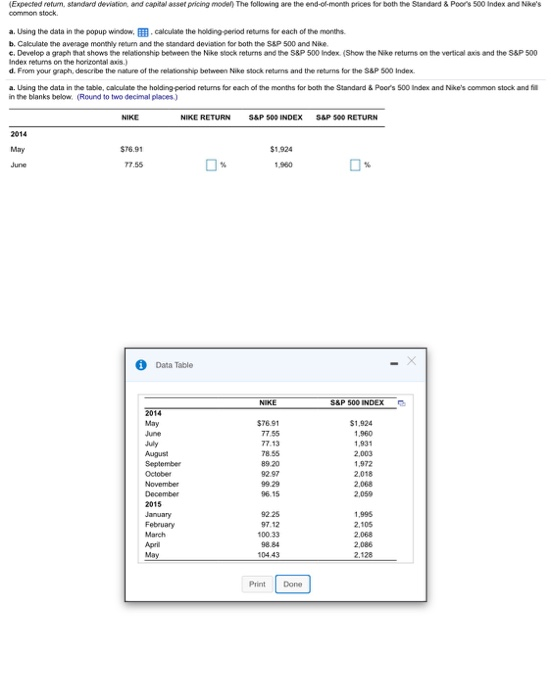
(Expected return, standard deviation, and capital asset pricing model) The following are the end-of-month prices for both the Standard & Poor's 500 index and Nike's common stock a. Using the data in the popup window, calculate the holding period returns for each of the months b. Calculate the average monthly return and the standard deviation for both the S&P 500 and Nike c. Develop a graph that shows the relationship between the Nike stock returns and the S&P 500 Index Show the Nike returns on the verticals Index returns on the horizontal axis.) d. From your graph.describe the nature of the relationship between Nike stock returns and the returns for the S&P 500 Index. and the S&P 500 a. Using the data in the table, calculate the holding period returns for each of the months for both the Standard & Poor's 500 index and Nike's common stock and fi in the banks below. (Round to two decimal places) NIKE NIKE RETURN S&P 500 INDEX S&P 500 RETURN 2014 May $76.91 $1,924 77.55 77.55 % 1.900 % Data Table NIKE S&P 500 INDEX 2014 $76.91 $1.924 1,960 1,931 2.003 September October November December 2015 77 55 77.13 78.55 89 20 92 97 99.29 16.15 2018 2.068 February 92.25 97.12 100.33 98.84 104 43 2,105 2.068 2,086 2.128 Print Done
Step by Step Solution
There are 3 Steps involved in it

Get step-by-step solutions from verified subject matter experts